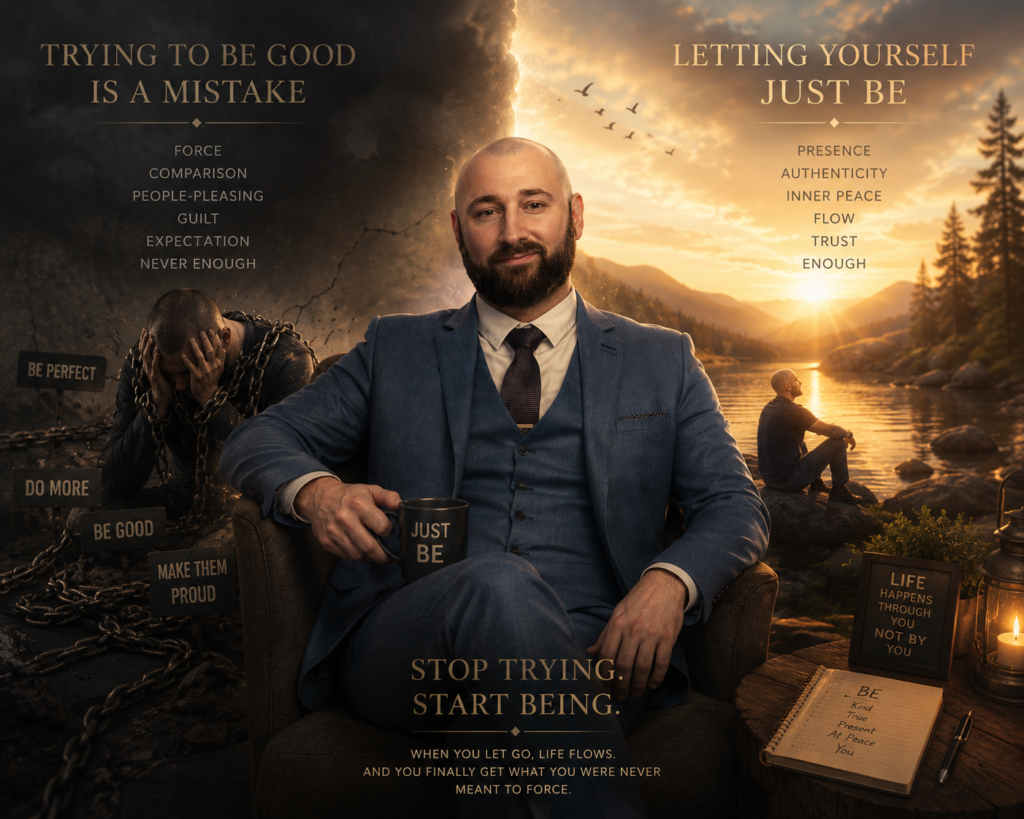
The Market Did Exactly What I Expected — Without Me
The Market Did Exactly What I Expected — Without Me Read More »
So, the market has fallen 2517 points in 4 days, going straight down. Lovely price action, very easy to navigate if you are a position trader. These are the days you hope for! That being said, I had a losing day yesterday. I have not traded well and taken chances where I should have waited.
I had FOMO. And this still is my greatest flaw, because I am afraid I will miss the move. And I put on trades even on subpar trade signals. That being said, I think I acted professionally, and I wasn’t too distraught about the losses. I worked on overcoming my problem, but I did ignore the fact that I was trading a trading range day.
The market pierced through the 786% level but only slightly, reversed and managed to close right on the level. It has managed to overbalance the last two major corrections, which leaves us with only one correction to go. If we surpass this correction, which is only 441 points away, and sits right next to Tue 14 Oct low, the market has turned, and it can no longer be called strong. So, let’s wait and see on this.
The 3-day trend is still down, and the 50% or balance point is short-term bearish.
Going down to 1 hr chart, if the market wants to go up, it needs to go above the 1:1 with the last correction and stay above that level. If it wants to go down, it will meet strong support at the 45,452 low, coupled with the 1:1. Right now, the market looks bearish, but going above 46,431, the 1:1 up and 46,495 resistance spells a rethink of the situation
I will trade the 3 min chart. The ATR is 632 points right now, which means we have 632 points at our disposal in order to make some profit.
The market has opened unchanged. 18 min have passed, and I have found some geometry. We have a 1:1 with the last correction in 618% with a double bottom pullback (DB/PB) reversal pattern. I will take a trade here, going long 3 points above the 14:45 bar and a stop 3 points below the low of the day
I almost got stopped out, and by sheer luck, I was not taken out. But the trade is working nicely so far. I have moved my stop to breakeven, and I have my eye on the high of yesterday as a possible exit target. I’ll just have to wait and see
And I have been stopped out on breakeven. Frustrating!
I have another buy signal. The market has made an ABCD in 786%, you can call it a Gartley even. And it has given me a DB/PB buy signal pattern. So, I am going long here. I am in a trading range, and this feels more risky than usual. Just a thought!
Stopped out again. This time, a losing trade!
I am selling 3 points below the 17:03 bar with a stop 3 points above because it has reversed in 382%, and the open price area
It hasn’t gone through. I will delete the order and go long here
Stopped out again!
I seem to be out of sync with the market. I will buy here because of the ABCD in a double bottom, and we are at the bottom of the trading range.
I will buy the breakout and move first stop at breakeven. We have strong resistance here with the 382% open and the previous high. I feel some fear because I added too close to it
I will move the stop to breakeven on the add
Stopped out of the add, but I still have my original trade. The market has moved down to support, and the 382% of today’s range and then continued to move up
I am buying again on this false break in 50%
I have been stopped out of both of my trades on breakeven. I will stop trading. Another losing day!
I have two losing trades -151 points, and 4 breakeven trades. Disappointing, but that’s what it is
Hmm, it seems I’ve quit too soon. We had a false break at the bottom of the trading range, followed by a very nice rally. False breaks can be very good signals, but I missed it this time
The Market Did Exactly What I Expected — Without Me Read More »
In this Dow Jones trading journal, I break down a losing session where multiple setups appeared, but emotional decision-making and lack of clarity led to poor execution.
This post is designed to help traders understand that losing days are not just about strategy — they are about psychology, discipline, and timing.
Date: Tuesday, 18th November 2025
Market: Dow Jones (YM)
Condition: Strong bearish momentum
Ok, so Monday, the 18th of Nov 2025, the Dow Jones cash market has continued to decline. We have now closed on the 618% retracement from Tue 14 Oct low to Wed 12 Nov high, and we have breached the low of Fri 07 Nov. The market has fallen very quickly. Faster than it went up. But that’s how markets react when they are sold.
The 3-day trend is down, and the 50% is bearish. If we go below the low of Fri 07 Nov, we should see the market go to the 786% level. The 3-day high is at 48,233, which means we have a ways to go before we turn bullish, another bearish connotation
Going down to 1hr and 15 min time frames, I can see we have made a double bottom breakout and also exceeded the ABCD from Monday’s price action.
This suggests a continuation. But the market also stopped at a major double bottom in 618% retracement, coupled with a 1.618 expansion from Monday’s high. If we keep above these levels, I would like to be a buyer, but if we go below Monday’s low, then I would want to be a seller.
The 1:1 with the last correction is at 46,947, which is make or break (MOB) level one and the 382% of the whole move down is at 47,194, which is MOB2, and the third one would be the 50% at 47,430, where we have Monday’s high as well
FIRST PHASE – UNCLEAR CONDITIONS
The market opened with a gap down and has hit the 786% level. The slow stochastic is overbought, which suggests a sell. I will wait for more information. The ATR is 621 points, and we have already gone down to 537 points. And we have just gone below the low of the day and the 786% level. I will wait because I don’t see any reliable pattern to work with right now.
So, I’m still out of the market!
The last correction was 263 points, so the 1:1 with the last correction is at 46,211 so far. And now we have a false break, and we are above the 786% level, and a small 1-3-5 pattern
SECOND PHASE – FIRST LOSS
So, now I have a buy signal. We have had a move below the low, which has resulted in a false break. And we have a 1-3-5 pattern with a Double bottom pullback. I will buy 3 points above the 15:30 bar with a stop 3 points below it.
I have taken a very fast loss. If it goes below the low of today, I really want to be a seller, but I have to watch and see what happens
I did not sell below because I do not like the price action. I may be wrong, but when in doubt, stand aside
I have bought again here because the market has rallied after completing a small ABCD, which made a false break as well. I have waited for more information, and now I am buying this 16:18 bar
We have gone above the 1:1 with the last correction and have returned to test the breakout. I am tempted to buy again here, but I will wait to see if it breaks out again and then buy
I have been stopped out again. This time it hurts!
PSYCHOLOGY BREAKDOWN
My thoughts and feelings are quite conflicted right now. We do have a double bottom pullback with a bad retracement and a reversal bar pattern. But I see it’s a trading range, and the price action isn’t giving me any confidence. So, I am going to wait and not go long
Well, now the emotions come flooding in. I saw the trade, but I did not take it. The two losses earlier made me fearful and overanalyse the market, and I did not trust my judgement anymore. ‘’Funny’’ things happen when you are underwater from the start of the day. And by funny, I mean fear and pain have kicked in, and your objectivity is out the window
I will go with the trend buying on a breakout, but the upside I see is limited. The market is very close to resistance and the 382%
I have been stopped out again. I am not trading right, so I will stop before I do more damage to my account. I was too eager to make money, and I did not protect myself as I should have. So, I lost! Losing day today. It hurts! But tomorrow is another day
What happened next was that the market went sideways for two and a half hours, then proceeded down, staging a breakout of support
There was money to be made today, but I just didn’t hack it. I will retreat and lick my wounds. My conscious mind knows that a loss is a loss, and this business is full of them. But it still hurts!
Trading Lessons from This Session:
Before entering a trade, I check:
If these are not aligned → no trade
Losing Day, Emotional Trading & Missed Moves – Dow Jones Trading Journal Read More »
Understanding Dow Jones trading patterns is essential if you want to trade the market with structure instead of guessing. Over time I have focused on a small group of patterns that repeatedly appear in the market.
These patterns combine Fibonacci ratios, market structure, and price action. When multiple patterns align together, they create high-probability trading opportunities.
Below are the main patterns I use every day when trading the Dow Jones.
Fibonacci ratios play an important role in market structure and price behaviour.
For retracements, I primarily use:
38.2%
50%
61.8%
78.6%
In strong trending markets, the price often retraces only to the 38.2% or 50% levels before continuing in the direction of the trend.
When the market becomes weaker or starts to reverse, deeper retracements such as 61.8% or 78.6% often appear.
For expansions, which occur when the market extends beyond previous price swings, I focus on:
127.2%
161.8%
These levels frequently mark areas where the market either accelerates or begins to reverse.
The ABCD pattern is one of the simplest and most powerful price patterns.
It consists of two legs that are roughly equal:
AB = CD
The market moves from A to B, then retraces to C, before making a second move from C to D.
When the pattern completes, the market often reacts in the opposite direction.
Sometimes the CD leg extends slightly beyond the AB leg. Ideally we want perfect symmetry, but markets are rarely perfect. Traders must learn to adapt when price action is slightly different.
If the pattern fails to produce a reversal, it usually means the trend is strong, and trading in the direction of the trend can still be safe.
The Gartley pattern combines Fibonacci ratios with the ABCD structure.
The retracement from X to A typically reaches one of these levels:
38.2%
50%
61.8%
78.6%
In the example shown in the chart, the market reversed from a 78.6% Gartley pattern that also formed a perfect ABCD structure.
Unlike a classic ABCD, the CD leg in a Gartley does not always equal the AB leg. Instead, it can extend to:
38.2% of AB
61.8% of AB
When these ratios align with other market structures, the probability of a reversal increases.
The Butterfly pattern is similar to the Gartley but with one important difference.
In this pattern, the ABCD structure extends beyond the original XA swing, reaching an extension of:
127.2%
161.8%
Butterfly patterns are commonly found at major market tops and bottoms.
For example, before the major market drop during the COVID crash, the Dow Jones showed a massive 127.2% Butterfly pattern on both the daily and weekly charts.
This type of alignment across multiple timeframes often signals significant market turning points.
After a strong trend, the market can begin to lose momentum.
One sign of this is the Three Drives pattern, where the price forms three pushes in the same direction.
During this process:
Each wave begins to overlap
The market struggles to push further
Momentum slowly fades
This pattern often appears before a major reversal, especially when it forms near important Fibonacci levels or resistance zones.
A Line in the Sand (LIS) is created when the market forms a double top or double bottom.
These levels often become key support and resistance zones.
The price will frequently test these areas multiple times, switching between support and resistance.
Traders often treat the LIS as a balance point, where buying or selling pressure becomes clear.
However, I prefer to trade these levels only when they align with a Fibonacci ratio.
Another reliable pattern is the Double Top Pullback (DT/PB) or Double Bottom Pullback (DB/PB).
In this setup:
The market forms a double bottom
The second bottom exceeds the first
Price then retraces in a pullback
The market resumes or reverses the trend
This pattern forces the trader to wait for confirmation, which often results in more reliable trades.
Make or Break levels (MOBs) are areas where the market previously found strong support or resistance.
When trading intraday, I usually focus on market data from the last three days.
The market often leaves clues about future direction based on how it reacts to these levels.
For example:
If the market moves above a previous resistance level and holds, the trend may strengthen.
If it fails and reverses, it often signals weakness.
In the above chart:
The market surpassed the 1:1 level after the previous correction (MOB1).
This suggested the trend might be weakening.
However, the price immediately encountered a 38.2% Fibonacci retracement, which acted as strong resistance.
This became MOB2, while the 50% retracement acted as MOB3.
As long as the market remains below the 50% retracement, the market structure must be considered as still weak.
For the bullish case to develop:
Price must hold above the 38.2% retracement
Then break above the 50% level
If this happens, the market has overcome the main technical resistance levels, and buying opportunities may appear.
For the bearish case:
Price must break below the 47,626 low (MOB1)
Then move through the 61.8% Fibonacci level (MOB2)
If these levels fail, it suggests that downward momentum remains strong.
This is what happened
The trend is still down!
These are the core Dow Jones trading patterns I rely on every day.
There are other patterns I occasionally use, but these are the most reliable.
The real key to trading is combining multiple confirmations:
Fibonacci levels
Price structure
Pattern symmetry
Market context
The more factors that align together, the higher the probability of a successful trade.
And remember:
Patterns become more reliable on higher timeframes.
Dow Jones Trading Patterns I Use: Fibonacci, ABCD, Gartley & Market Structure Read More »
In this Dow Jones trading journal, I document a session filled with missed opportunities, bias, emotional decisions, and eventual recovery.
This post is written for traders who are learning how market structure, patience, and discipline matter more than being right about direction.
MARKET CONTEXT
Date: Monday, 17th November 2025
Market: Dow Jones (YM)
Session: US Open
Market Condition: Volatile with failed breakouts and reversals
So, the 14th of November bar was on a Friday, and it closed in a doji /hammer style. Now, since Tuesday, the 14th of October, the market has rallied significantly, going into new ground until Wednesday, the 29th of October. Then it had a ‘’bad retracement’’ (a bad retracement is when the market overlaps and hardly goes anywhere), and it finished on a Gartley in 50%. With a beautiful bullish hammer bar. Providing a buy signal.
It succeeded in going up into new territory on a great four-bar rally. At which time it made a false break, falling 843 points and making a reversal pattern as well. But now what has happened is that from my research, a big down bar like that followed by a doji bar means the next day should be a bull up bar in more than 85% of the cases.
And this takes us to the current day. I see that the market hasn’t overbalanced the last correction. In fact, it has stopped 36 points above the 1:1. So, for starters, I am bullish on today’s action, but even though I have formed an opinion, I still have to wait and see what the market is telling me once it opens
BIAS & PRE-MARKET ANALYSIS
Looking at the hourly and 15-minute chart, I see that the market has finished exactly on an ABCD, coupled with a 50% retracement. This further strengthens my bullish hypothesis. But I still have to be mindful that the medium-term 3-day trend has been breached and it has closed below, and this signifies a change in trend, and also the market is still under the 50% retracement, which has weakness connotations as well
I am so bullish on this that I am beginning to think I may be very biased and look for any buy opportunity when there isn’t any. I have to wait and see what the market is doing. Looking at the 3 min chart right now, it must break the small double bottom low at 46,864 and break through the 1:1, which is at 46,834. And the above make-or-break levels are the top of Friday’s range, sitting at 47,380, and then the 382%, coupled with the gap from yesterday’s action
FIRST TRADE – BIAS TAKES OVER
The bell has rung, and the market has opened lower than the ABCD. This suggests a continuation down, so let’s see. The second 3-minute bar has reversed and closed up in a strong manner right at resistance from a 618% Gartley, coupled with the LIS (Line in the Sand) from a few weeks ago. Even though it has surpassed the 1:1 ABCD, I will take a long here because it supports my bullish case, and if I look closely and extend the CD line by 1.272%, it will measure to 47,038, and the low is 46,995. I am taking a buy position here, 3 points above the high of the second bar of the day, with the stop below the low of the day
The market has triggered my order, and I am in the market and underwater for 45 minutes now. I am thinking I have made a mistake, and the trade won’t work, but I see it has retraced nicely from the opening price. All in all, I will let it play out, but too much time has passed, and it’s anyone’s game now. I was very sure it was going to go up, but now I am not so sure
The market has made an ABCD and rallied again, but I almost got stopped out. It does not look good so far
We went below the low of today, and I have been stopped out. I am out of the market and assessing my next move. It hurts, but not as much as I would have thought. I tested my hypothesis, and it didn’t play out. It’s funny how you can always find a reason why it didn’t after the fact!
Lesson:
For example, where I took my position long, the market was sitting right at resistance, having surpassed an important ABCD, and it finished the move right in a combined ratio of 618% from CD and 50% from AD. That is the geometry that has pushed the market lower, but I chose to ignore it, so I lost. Alright, now back in the saddle
SECOND ATTEMPT – CONFUSION & OVERTRADING
The market has hit the bottom the 3rd time, and we have an ABCD right there, the stochastic is oversold, and it has made a reversal pattern with a butterfly pattern in 1.618% attached to it. It is better to sell double bottoms than buy them. The reason is, when traders see weekness they tend to hammer it. That is why markets fall faster than they rise. I will take a long here, and if it goes below the low, I will sell short
So far, the market has agreed with me, but now we have to negotiate a strong resistance zone where the 382%,1:1, LIS, and the open are aligned together. This is strong resistance, and if we go through, we will go much higher, so let’s see
It has blasted through the levels and reversed. It’s to be expected because there is strong resistance there. And yes, it could return the other way, but I will keep the trade, and if it goes above, I will add to it. I forgot to mention I have moved the stop to breakeven after the second bar up
I have added to my trade, and the market has moved above the 50% and is close to the resistance from yesterday
The market is moving sideways, it’s not the action I want, so I’m moving the stop loss to breakeven on the add-on trade
I have been stopped out of both my trades. It hurts! I couldn’t exit at a profit for the first trade. I kept hoping!
📌 Mistake:
What I should have done was to move both stps bellow the trading range that has formed, and after the false break, I should have reversed short because all the signs are there. Hope is a hard thing to negotiate when you are in a trade
We have a 1-3-5 pattern with a double bottom pullback in 786% and a reversal bar signal, albeit not a very good one. I will take a long here 3 points above the 18:12 bar with a stop 3 points below the low. And if it fails, I will go short if it reaches the triple bottom, as usually the 4th time brings on a good trade, I will wait and see
I have been stopped out in no time. I am out of the market and waiting on the sidelines. Today hasn’t gone very well for me so far
We have made a new low at 48,855. The 4th try has held, and we may see the market going up. I would have sold, but it did not go 3 points below the low bar. The market came down and, after a short retracement, proceeded to move down in a ‘’bad continuation’’ fashion. That is always a sign of reversal in my book, but I see I have been making all the wrong decisions so far.
FINAL TRADE – PROCESS RETURNS
Market reversed, and I have sold it at the 4th low
I have moved the stop up to breakeven after the second bar down after the entry. And we have overbalanced the previous correction to a major degree, so let’s see what will happen. The market has gone down close to the big ABCD from the day’s action and is showing signs of bad continuation
The market has moved through the ABCD and overbalanced. This is usually a good sign that the trend will continue. I have my eyes on the 46,495 low as a possible target. That being said, it is 19:36 now, so I want to protect some profit, so I will move my stop down 3 points above the 19:36 bar
I have moved my stop loss again
We have gone below the 46,495 major low. I have moved my stop down two more times, and I was finally taken out of the market. I have lost two trades, which total – 217 points, and won one trade, which has made me +374 points for a total of + 157 points. This would have been a good day in the end.
But I risk 3% of my account per trade. That 3% is divided by the number of points I risk, and it gives me my stake (how much I put per point). And after all that, the amount I made is a measly £78 from a £5000 account. If the account were bigger, it would have been a pretty good day. This goes to show that the amount of points you win doesn’t always translate to what you would think. And the market has moved sideways to up from that false break into the close
📌 Key Lesson:
Points do not equal money.
Account size and risk management matter more than being right.
Trading Lessons from This Session
‘’Missed Trades, Bias, and Recovery – Dow Jones Trading Journal’’ Read More »
This Dow Jones intraday trading analysis documents how I approached a volatile market session using structure rather than prediction. The market opened with increased volatility, and my focus was on how the price reacted around key retracement levels, ABCD patterns, and the average true range. I was not interested in guessing direction but in observing what the market was doing and responding accordingly.
Throughout the session, I paid close attention to false breaks, overbalance, and how the price behaved around support and resistance. Entries were taken only when the structure aligned, and stops were adjusted as the market provided confirmation. While profits were made, there were moments when I questioned whether stops were moved too aggressively. This breakdown is not about perfection, but about execution, discipline, and learning from the decisions made in real time.
On the 13th of November 2025, the Dow Cash market fell 843 points. About 300 points more than the average at the time, and stopped at the major 50% retracement, which provided support. This pattern here is showing me, based on my research, that a continuation is possible of at least half the points of the 13th of November daily bar. I will have to wait and see…
The 3-day medium trend at 46,934 is still up, but from a stochastic point of view is overbought. And the 50% support has been breached slightly. In my opinion, right now the market will move lower, but I have to wait and see what signs I will receive once the market opens.
The market has opened on a gap down below the 618% 500 points down, and the average true range is 580 points. Right now, it has made a false break of the 3-day low and 786% and did not overbalance the 1:1 with the previous correction. This is a buy signal in my book, but I will wait for further confirmation.
We now have a small ABCD into a double bottom in 786%, and the ATR has been taken out by 18 points. I will buy 3 points above this 15:15 bar and put a stop 3 points below the range
The market pushed above the ABCD and LIS resistance, which is a good sign for now. Not a strong move up, though. I have moved stop to breakeven.
I have added to the position on a breakout
I have moved both stops up
I HAVE ADDED ONE MORE TIME
I have moved my stops up, and I am waiting to see if it will reach the 382%, which is at yesterday’s close
And the 15:48 bar has taken me out. First trade +267p, second trade +92p, third trade has lost me -53p. For a total of +306p. I could have stayed longer in the market, but I was afraid my profit would be much reduced. So, I moved my stops up and took a good profit. I am pleased with the outcome, but I can’t shake the feeling that I should have waited a bit longer and not moved the stops so close
Right now, I am pleased that I have exited the market because I would have been stopped out at a much lower profit. This is interesting, though, because we have made an ABCD balanced retracement a few points above the 382% of the whole move, which is right at a known support level, and the market has closed up. This suggests a long again. The only thing I don’t like is that it has overbalanced the 170 points of the last correction.
That trade would have been a loss if I had gone long. I will stop trading for the day. I am pleased with the profit
It has gone up 517 points. It is now 18:48, and I can see two possibilities…
Given that the market is at a 382% RET paired with support and an ABCD, it has a chance to go and reach yesterday’s closing, where incidentally the big 382% of the past two days is. Or because we have gone up so much, we might see a trading range up until closing. I am more in favour of the trading range scenario, so let’s see
This is what happened next… The 3-day low has held, and the market has closed above the 50%, so it is still in a strong position. The daily bar is a doji bar. A down bar followed by a doji bar in my research suggests the next-day bar should be bullish. We will just have to wait and see
“Dow Jones Intraday Trading Analysis | Market Structure & Volatility” Read More »
Ok, this day is the 13th of Nov 2025, and I am looking at the Dow Jones market. The 3-day trend is up, and the 50% balance point is bullish. So, the medium-term trend is up. This is our starting point for the day…
Going down from the daily to 1 hr and 15 min time frames, we see that the market has formed a bullish rectangle. The 1:1 with the last correction is 396 points down at 48,.038 exactly, where major support lies from the old high.
We are in no man’s land right now. The average true range is at 514 points. The ranges have expanded. Yesterday’s range went up 503 points, then returned to congestion.
Looking at the 3 min chart, if the market exceeds yesterday’s high, I will look for long trades. If it moves below the 1:1 and support levels at 48,038, then I will look for short trades.
The market has opened on a gap down right at the ABCD, exceeding it but closing up. The market has hit support, reversed and made a small ABCD, saying it might want to go down. I won’t take a short here because it is quite a weak signal. Now it has penetrated the day low. It’s 15:21, and the market can’t break through; it is in a trading range right now
The market has made a perfect 382% in resistance. That is a sell signal, but I did not see it at the time. And now it has reached the 1:1, exceeding it slightly
It’s 15:57, and I have missed a good trade. The market has closed the gap from yesterday
The market moved down violently, and I have sold the first major retracement. The first one rarely holds. Then it overbalanced the first correction, which would mean the trend might be in trouble. But it made an ABCD balanced correction. So that gave me trust to sell the double bottom and move the stop on the first position at breakeven. Now at the big 382%, I have moved both stops 3 points above the bar that touched the 382%
I have moved my stops after the 382% on the high of each bar that closed below the previous bar. There were two bars, and after a tight trading range, I was taken out of the market. I have made 175p + 92p= 267 points. I find it pretty good, it is now 19:30, and I will stop for today. I am still upset because I have missed the first trade.
The market succeeded in reaching the 50%, coupled with major support and closed on that level. Great trend day! The market fell 843 points. It still did not turn the 3-day trend down, but if the 50% fails, the market is in a weak position
Missed First Trade Of The Day Read More »
Focusing on what you want may not be what can move you forward. I know this may seem paradoxical and counterintuitive and go against everything that everyone is preaching. Single focus on one thing and one thing only where I have to have that thing is a hoax. It’s something that people have made up when they could not put in words or otherwise explain how they got success.
Let me ask you this then… ‘’Why do so many people who go to self-development seminars fail? I mean don’t the teachers provide the same framework that helped them get rich or have a ‘’better life’’? Why don’t they succeed?
And the reason is that they focus on it too much. They want it and they go out to get it. They try and try and try again and fail miserably. Why is that? It’s because they want it too much! And when you want something too much you also have the fear in the back of your mind that it may not happen. You may be aware of that feeling sometimes but you push it away. Thinking that you shouldn’t have it, that you should only focus on the result. ‘’You should only focus on the result’’ is the most sought-after answer.
This is why people fail in relationships, in work, in business, and even in bed when you really want to have an orgasm, you don’t, because you arrest the natural process by striving to have something which only happens if you let it happen naturally.
The best thing anyone can do is to go and do the thing that they want to do and accept any result that may come after putting in all this effort. Accept that maybe you may never get the thing you are pursuing. Now this is fear at its highest, because people will ask… but why go for it if I expect it to fail? To which I would say, you are not expecting to fail, you are just not tied to the result.
And when you are not tied to the result freedom happens. You shoot the hoop at exactly the right moment, you make the decision at exactly the right moment, you end the relationship at exactly the right moment and you move on with a lightness in your heart.
You know you have done all that is to be done and are content with it. If you can do this, you will be happy even if you fail at something. Because it is not the end of the world and it is not the end of you.
You can move on and change or correct course with a level head, and thinking is not affected by the setback. You will be able to continue where others can’t, because you are now unaffected by your circumstances, by what happens or what comes your way. You know that you can always do something. You know you can move forward.
But if you still hold on to the result when you have a setback, you feel stuck, you feel the world is coming to an end and you cannot think of a way out. And that is how people remain stuck for many, many years. They just hold on and can’t seem to let go. Please reconsider your grasp on the result of whatever you are doing and you will see, as I have, that life will get easier and easier until each day when you wake up you have happiness in your heart and enjoy your day.
Thank you
Peace and love 😊
Focusing on what you want? Why is it destroying you? Read More »
So, what do I mean by going into the darkness and coming out into the light? Well, I mean that you face your fears and you overcome them. By facing your fears, you will learn just how big of a grasp they have on you. You can think about them all you want and can make plans as much as you like but it will never change anything.
Facing your demons is the only way you will ever accomplish anything! I like that statement because everyone uses it, everyone intuitively knows and believes it is the truth. But the paradox is, almost nobody is willing to try it. They may be fed up with the fears or limitations they have. But then, after a few short days or sometimes weeks of trying to get out of it, or to conquer it, they give up.
It becomes too hard and too real at the same time. So, they quit. And then another period where they get fed up comes and they try again. And again, it becomes too real or too hard and they quit, and the cycle keeps repeating itself and no one ever gets anywhere. And then old age comes, and you see the futility of what you have done until now. And now… well now it’s too late to do something about it.
Against any popular belief there always comes a time when it’s too late to do anything about it. And when you reach that point, regret sets in, and your heart will be sorrowed. Because you know if you just kept at it eventually you would have gotten it. But you didn’t!
Now this is the story of 80% of the population. That is a massive percentage and knowing it makes you think… ‘’If I will regret this when I am old, why the h**l stop now? Why, if it’s hard, stop. If I’ll regret it, why stop?’’
Well, the thing is… you think you have time. You think you have time to succeed at it. And if you fail now, maybe you try again later. This can be in anything. I once saw a lady saying she needs to stop letting people take advantage of her and she was over sixty. I always wanted a six-pack, but I never really went to the gym more than a couple of months each time. Thinking I have time. Now I’m in my mid thirty’s and still don’t have a six-pack. And if I go on like this I may never will!
The point is you need to do it! And it’s going to be uncomfortable at first, it will hurt, it will feel the worst. But then it gets a little bit better and a little bit better and a little bit better and so on until you can’t remember when you felt or looked like that. And that is moving through life in the top 20% of people. Life is not just to be survived. life is to be lived!
Love
Going Into The Darkness And Coming Out Into The Light Read More »
In other words, why don’t you do what you say you’re going to do? Why don’t you go further than what you perceive is needed? I don’t know how better to answer those questions than by telling you a story. With a scientifically proven method ingrained in it…
Let’s say you want to get rich. Have enough money that you will be comfortable and can play a little with. Buy nice cars and whatever you’re interested in. And you think of a business and start working at it. And you work and you work, and a few years go by with nothing to show.
Now you are getting restless. You feel burnt out. And you lose your motivation. And you just go through the motions. But you don’t believe you’re going to make it anymore. It’s taken too long and you’re tired. Psychologically you’re spent. You don’t want it anymore!
But you’ve put so many years and resources into this. Are you just going to give it all up? Are you just going to stop? And listen to all your friends and family who see how miserable you’ve become. You can! And there is no shame in that if you believe the business, you’re pursuing is not worth it or it can’t be successful.
But deep down you know you don’t want to quit. And at one point you stop caring if you’re going to succeed. You work at your business, but now… You have time for your family, your friends, and anyone who needs your help. You go to work, and it doesn’t bother you anymore. If you have results, it’s great and if you don’t it’s also great!
And you see you get momentum. You start having the enthusiasm you had at the beginning. But you have it with a truckload of experience now. And you start to have small successes. And small successes turn into bigger and bigger successes.
What just happened here? You’ve gone from wanting to quit and hating your life to moving forward and being happier in the process. Well, you’ve gone through what I call ‘’hitting the wall’’. Scientists call it the hope study. But I prefer ‘’hitting the wall’’.
You see when you think you can’t anymore. You’ve just hit the wall. It’s your body and brain’s way of telling you you’ve reached the threshold. From then on, your brain and body don’t know what will happen. What damage can occur? So, they try to stop you.
But by accepting that you will go on even if you may not get what you want. You have short-circuited that resistance. And now you have freedom. And the extent to which you can go is basically endless. You see, most people stop when they hit the wall. Even if they think they have moved past the wall a long time now. They haven’t! How can I tell…
Because when you hit the wall and move past it, you don’t care or need results anymore. You just do what you want to do. And you do it without fear. Or if the fear is there. You don’t care anymore. But this is not a sad predicament. You feel alive and energetic. And you put to use your experience. And it’s a great way of living and working.
Hope this helps and inspires you to keep on going!
Peace 😊
Why do we not reach our goals? Read More »
We all are taught in this Western culture to give our best. To strive to become the best at what we do. To be the all or end all. To go beyond what is possible and succeed in life with flying colors. Because that is when we will be enough.
We must work our a*s off in such a way that nobody can deny our presence. But this thinking, if you really look at it, is very flawed. And why is that? Aren’t we supposed to want the best for ourselves? Aren’t we supposed to be better, to help others, to provide everything for our families? How can you say that?
Well, look at it like this…
Every person that goes out of their way with the thinking that they have to be the best, to give their best, or just dominate so they can get what they want. Has failed to be just that.
If you look at documentaries of great people. You will see that they never thought about giving their best. They never wanted to get out the greatest product or be the best that they could be at their sport. Even if they say in interviews that they did. If you study their life, that is not the way they operate.
That is one of the reasons that watching their interviews and trying to do what they say can be and is very challenging. Because it is not true. They may think it’s true. But as I’ve said if you study their life and habits. They are doing exactly the opposite of what they ‘’think’’ they are doing. So, what is that thing they’re doing…
In a few words… ‘’They just do!’’
They go out and do things. They try and they fail and get up and try again. They don’t try to be the best or give their best. Every athlete who has ever succeeded does this. They just go for it! That is the underlying theme. Of course, they want to win. But it’s ok if they don’t!
Now for the average person. Not getting what you want the first time. Feels like the end of the world. And they think ‘’ I need to do better!’’. So, they try to be better next time. And they fail. And they try to be better. And fail again. Until they reach a point where they give up. And settle for less.
The act of trying to be the best, of trying to give your best, of having to succeed. Puts a bind on your actions. In other words, it keeps you back. It keeps you from fulfilling your dreams. Because you just have to have them!
‘’Why Giving Your Best Keeps You Stuck’’ Read More »