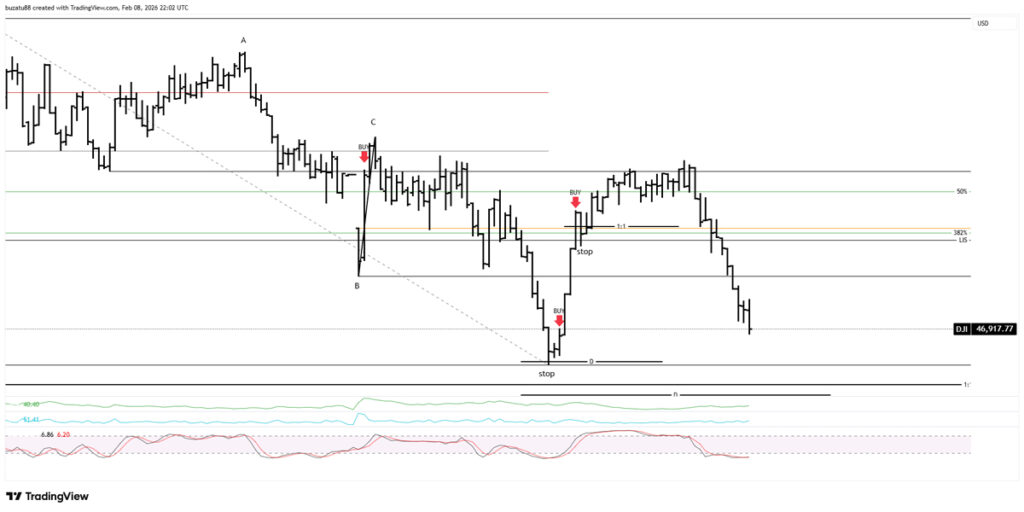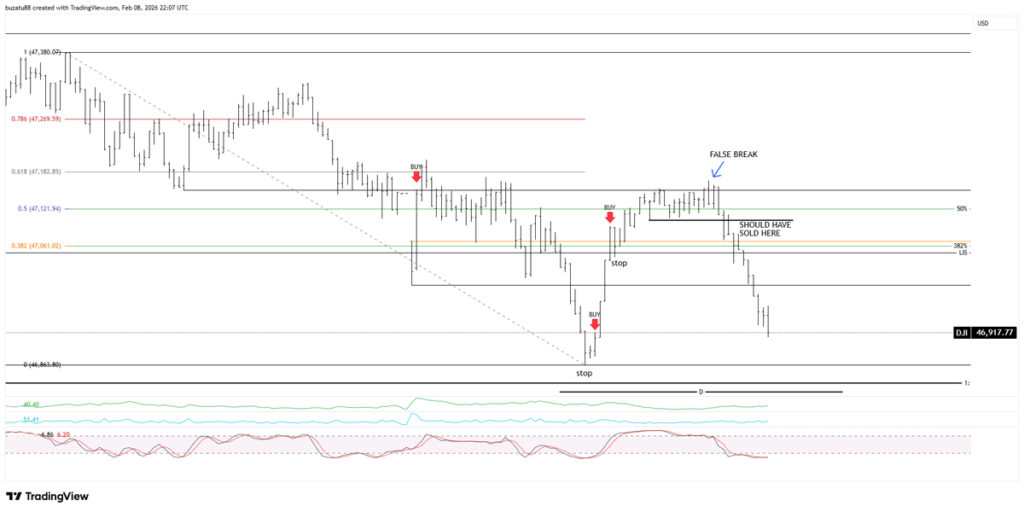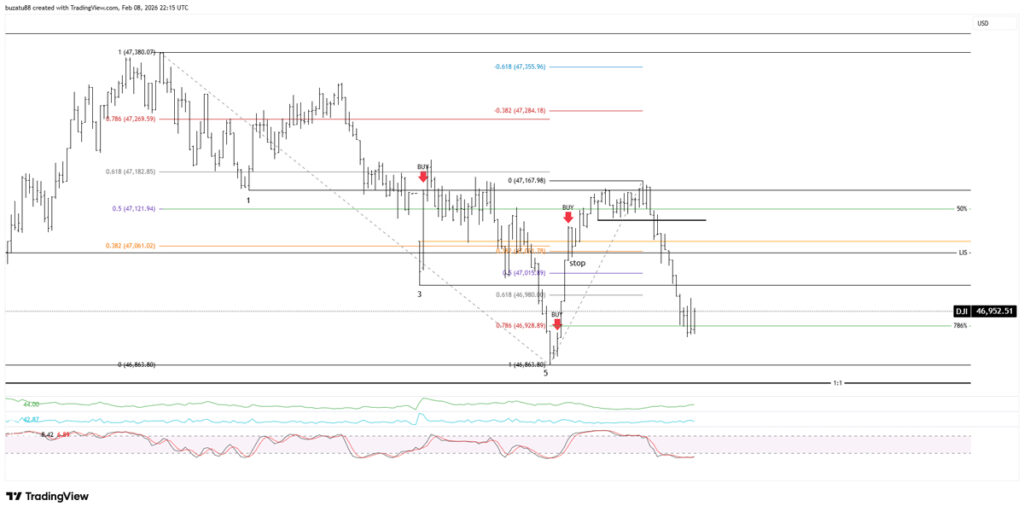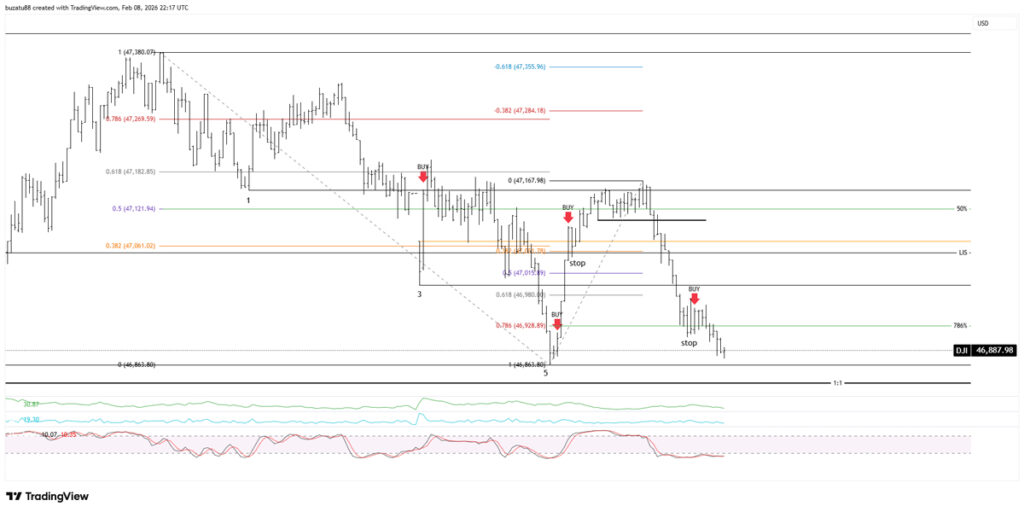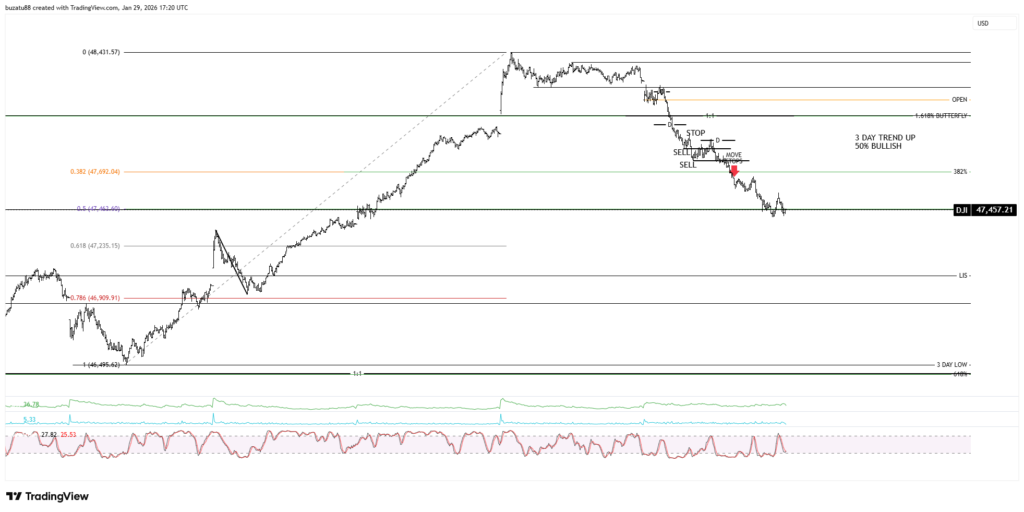
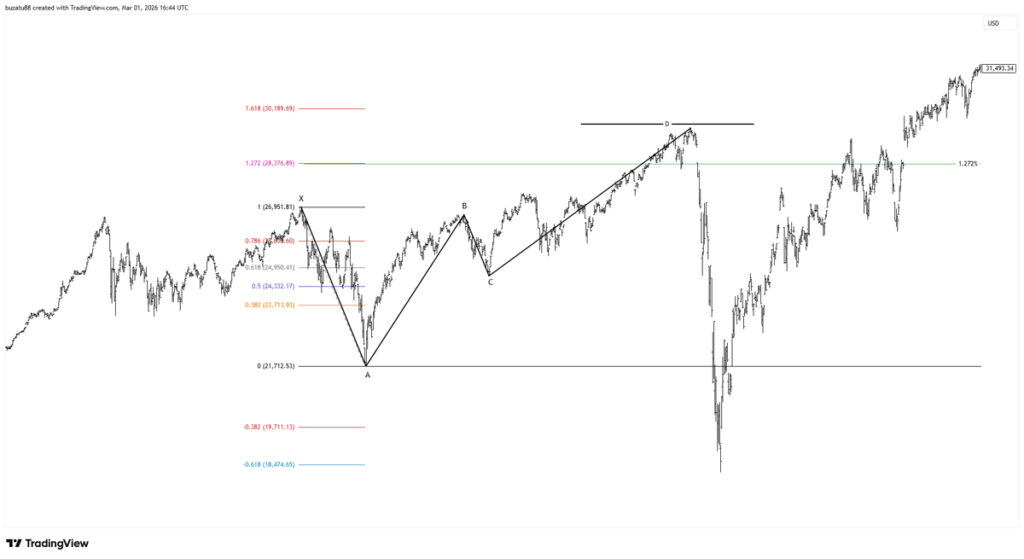
Dow Jones Trading Patterns I Use: Fibonacci, ABCD, Gartley & Market Structure
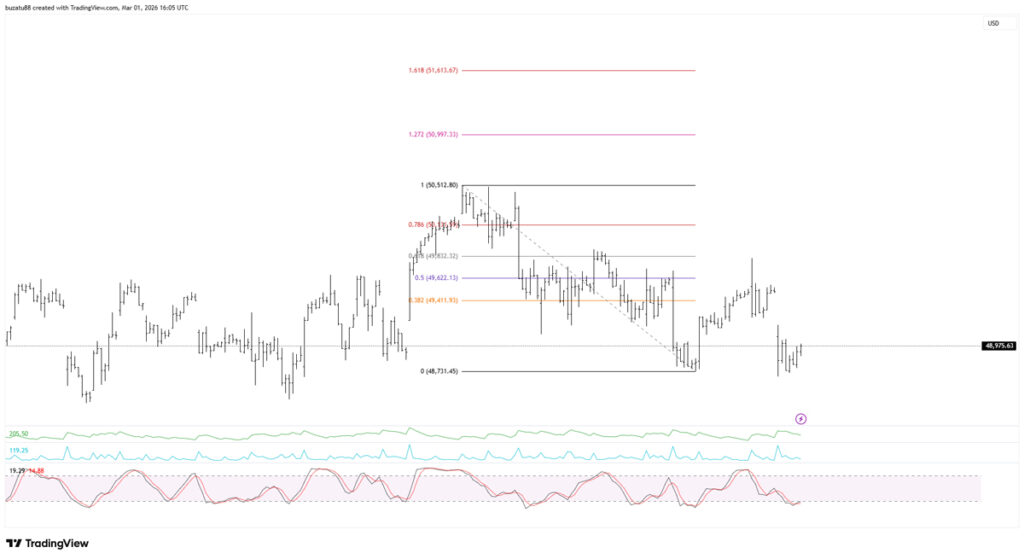
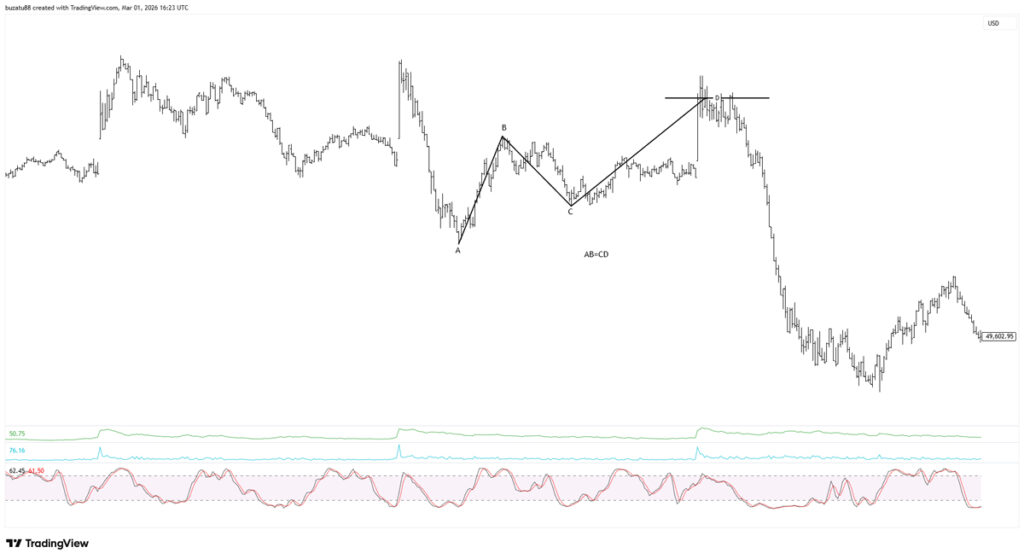
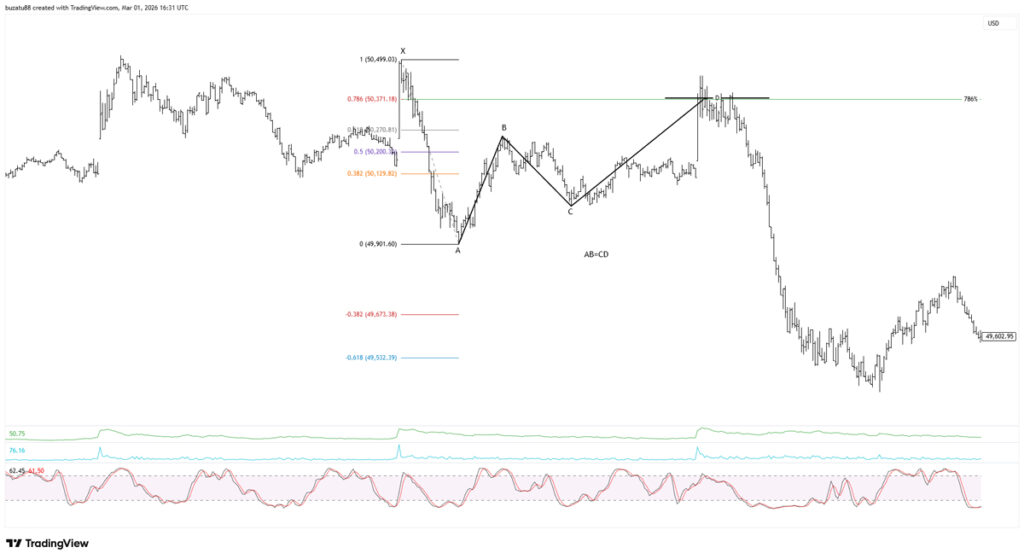
Dow Jones Trading Patterns I Use: Fibonacci, ABCD, Gartley & Market Structure Read More »