
Market Patterns I Trade
Understanding Dow Jones trading patterns is essential if you want to trade the market with structure instead of guessing. Over time I have focused on a small group of patterns that repeatedly appear in the market.
These patterns combine Fibonacci ratios, market structure, and price action. When multiple patterns align together, they create high-probability trading opportunities.
Below are the main patterns I use every day when trading the Dow Jones.
Fibonacci Ratios and Natural Numbers
Fibonacci ratios play an important role in market structure and price behaviour.
For retracements, I primarily use:
38.2%
50%
61.8%
78.6%
In strong trending markets, the price often retraces only to the 38.2% or 50% levels before continuing in the direction of the trend.
When the market becomes weaker or starts to reverse, deeper retracements such as 61.8% or 78.6% often appear.
For expansions, which occur when the market extends beyond previous price swings, I focus on:
127.2%
161.8%
These levels frequently mark areas where the market either accelerates or begins to reverse.
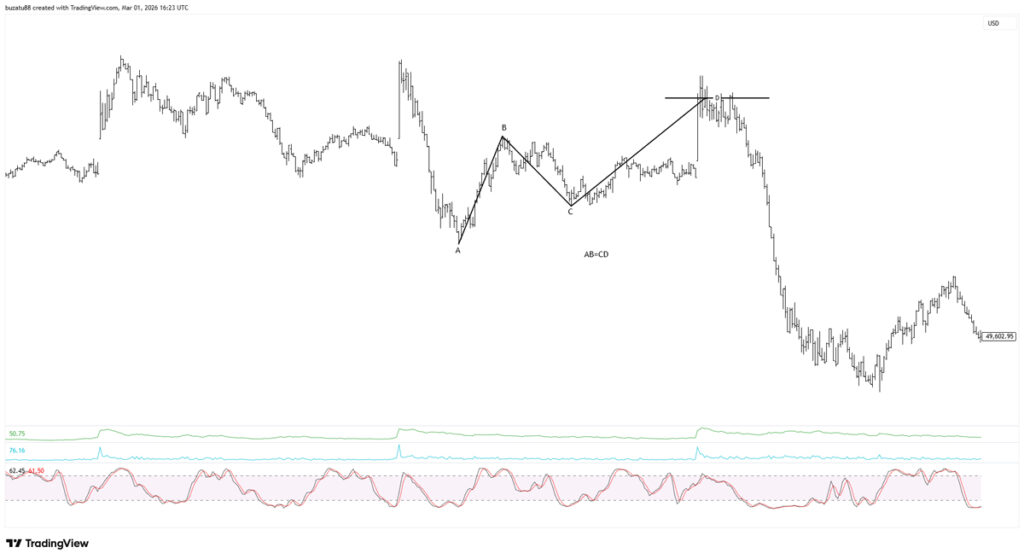
The ABCD Pattern
The ABCD pattern is one of the simplest and most powerful price patterns.
It consists of two legs that are roughly equal:
AB = CD
The market moves from A to B, then retraces to C, before making a second move from C to D.
When the pattern completes, the market often reacts in the opposite direction.
Sometimes the CD leg extends slightly beyond the AB leg. Ideally we want perfect symmetry, but markets are rarely perfect. Traders must learn to adapt when price action is slightly different.
If the pattern fails to produce a reversal, it usually means the trend is strong, and trading in the direction of the trend can still be safe.
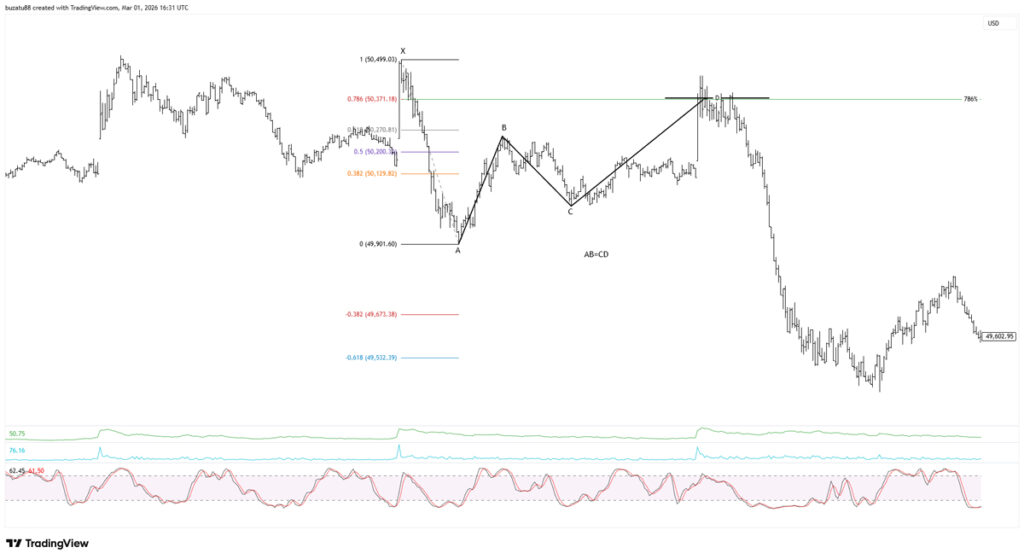
The Gartley Pattern
The Gartley pattern combines Fibonacci ratios with the ABCD structure.
The retracement from X to A typically reaches one of these levels:
38.2%
50%
61.8%
78.6%
In the example shown in the chart, the market reversed from a 78.6% Gartley pattern that also formed a perfect ABCD structure.
Unlike a classic ABCD, the CD leg in a Gartley does not always equal the AB leg. Instead, it can extend to:
38.2% of AB
61.8% of AB
When these ratios align with other market structures, the probability of a reversal increases.
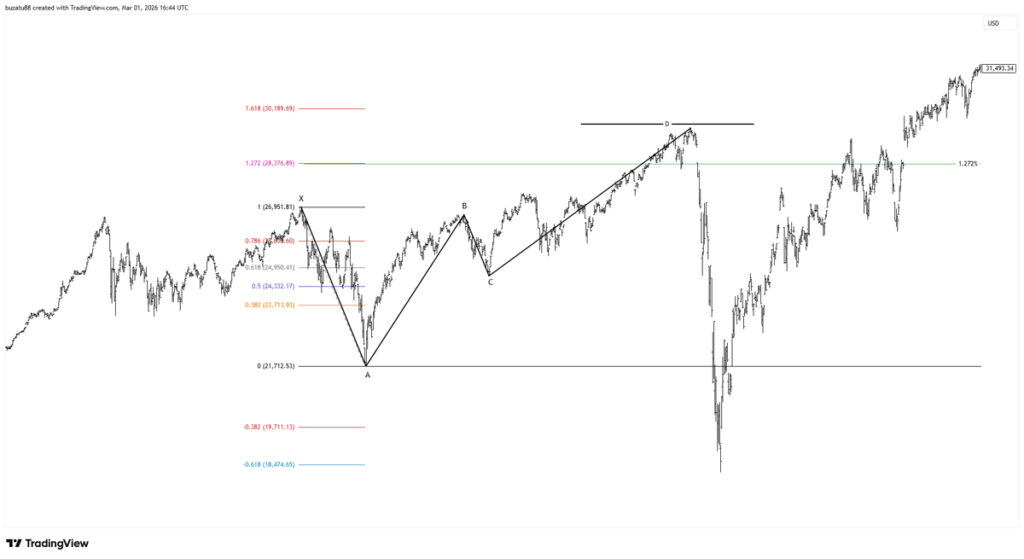
The Butterfly Pattern
The Butterfly pattern is similar to the Gartley but with one important difference.
In this pattern, the ABCD structure extends beyond the original XA swing, reaching an extension of:
127.2%
161.8%
Butterfly patterns are commonly found at major market tops and bottoms.
For example, before the major market drop during the COVID crash, the Dow Jones showed a massive 127.2% Gartley pattern on both the daily and weekly charts.
This type of alignment across multiple timeframes often signals significant market turning points.
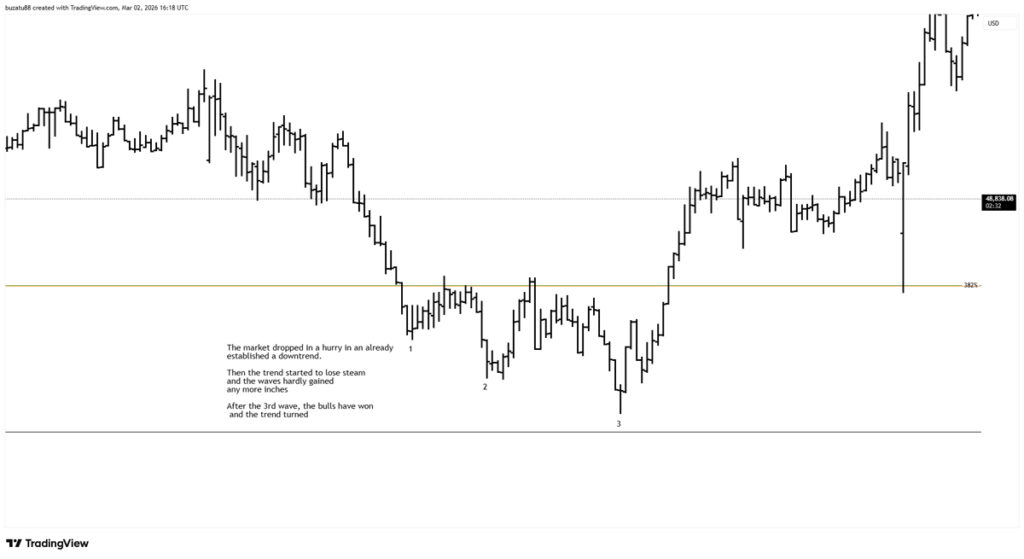
Three Drives to a Top or Bottom
After a strong trend, the market can begin to lose momentum.
One sign of this is the Three Drives pattern, where the price forms three pushes in the same direction.
During this process:
Each wave begins to overlap
The market struggles to push further
Momentum slowly fades
This pattern often appears before a major reversal, especially when it forms near important Fibonacci levels or resistance zones.
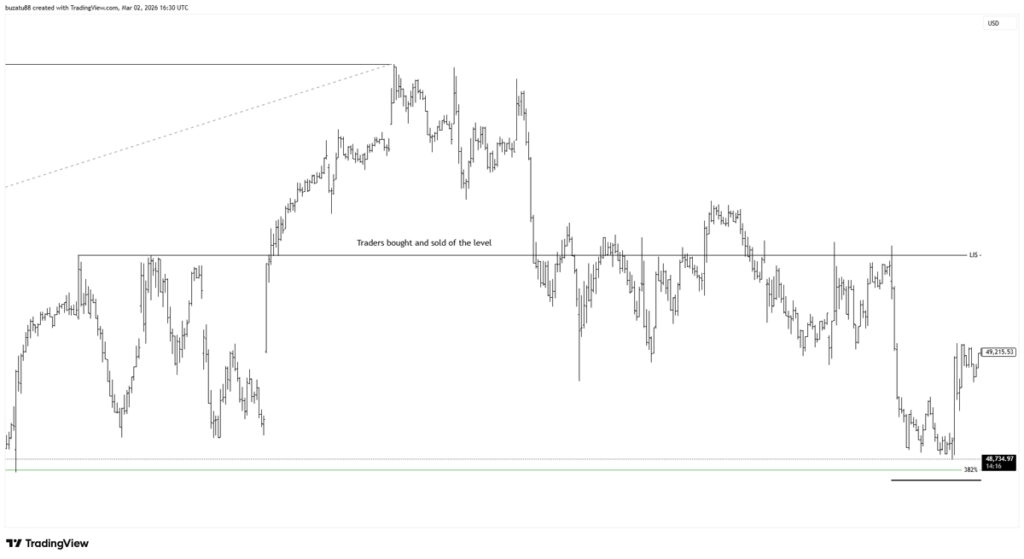
Lines in the Sand (LIS)
A Line in the Sand (LIS) is created when the market forms a double top or double bottom.
These levels often become key support and resistance zones.
The price will frequently test these areas multiple times, switching between support and resistance.
Traders often treat the LIS as a balance point, where buying or selling pressure becomes clear.
However, I prefer to trade these levels only when they align with a Fibonacci ratio.
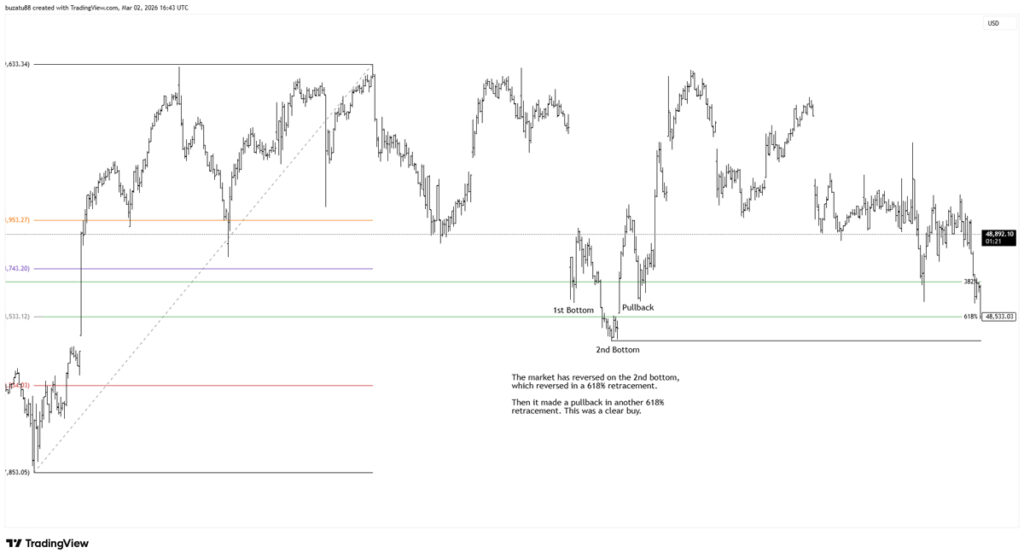
Double Top / Double Bottom Pullback
Another reliable pattern is the Double Top Pullback (DT/PB) or Double Bottom Pullback (DB/PB).
In this setup:
The market forms a double bottom or double top
The second bottom/top slightly exceeds the first
Price then retraces in a pullback
The market resumes or reverses the trend
This pattern forces the trader to wait for confirmation, which often results in more reliable trades.
Make or Break Levels (MOB)
Make or Break levels (MOBs) are areas where the market previously found strong support or resistance.
When trading intraday, I usually focus on market data from the last three days.
The market often leaves clues about future direction based on how it reacts to these levels.
For example:
If the market moves above a previous resistance level and holds, the trend may strengthen.
If it fails and reverses, it often signals weakness.
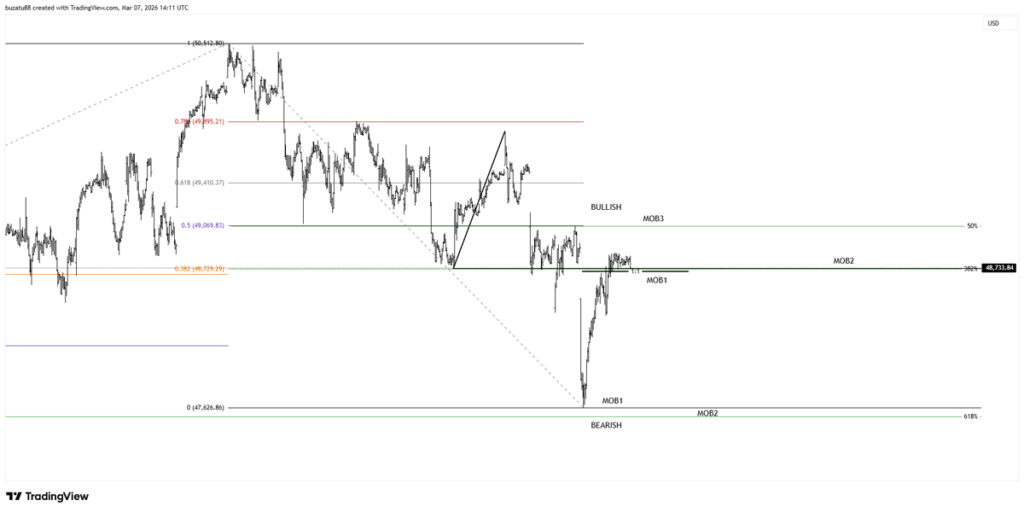
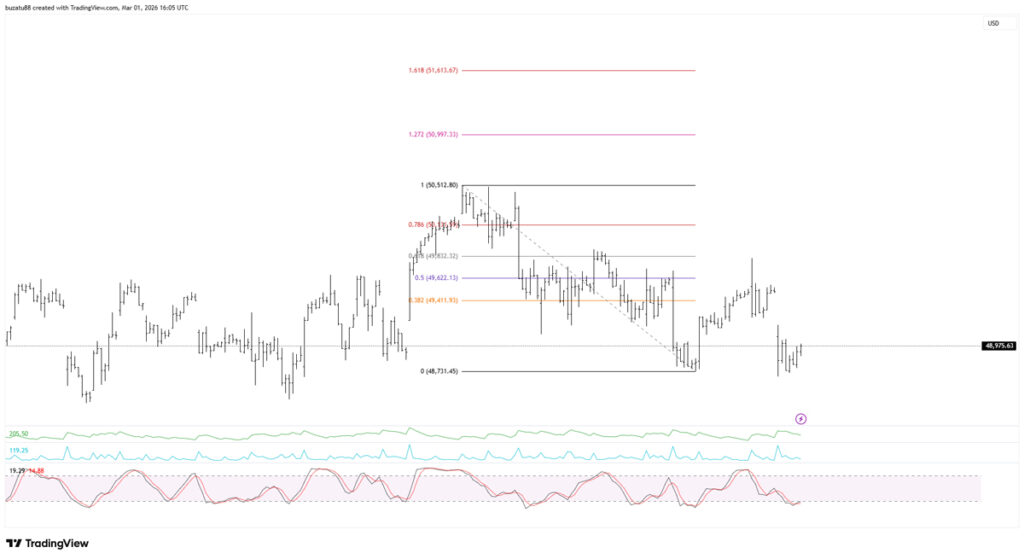
Example: Market Structure Analysis
In the above chart:
The market surpassed the 1:1 level after the previous correction (MOB1).
This suggested the trend might be weakening.
However, the price immediately encountered a 38.2% Fibonacci retracement, which acted as strong resistance.
This became MOB2, while the 50% retracement acted as MOB3.
As long as the market remains below the 50% retracement, the market structure must be considered as still weak.
Bullish Scenario
For the bullish case to develop:
Price must hold above the 38.2% retracement
Then break above the 50% level
If this happens, the market has overcome the main technical resistance levels, and buying opportunities may appear.
Bearish Scenario
For the bearish case:
Price must break below the 47,626 low (MOB1)
Then move through the 61.8% Fibonacci level (MOB2)
If these levels fail, it suggests that downward momentum remains strong.
This is what happened
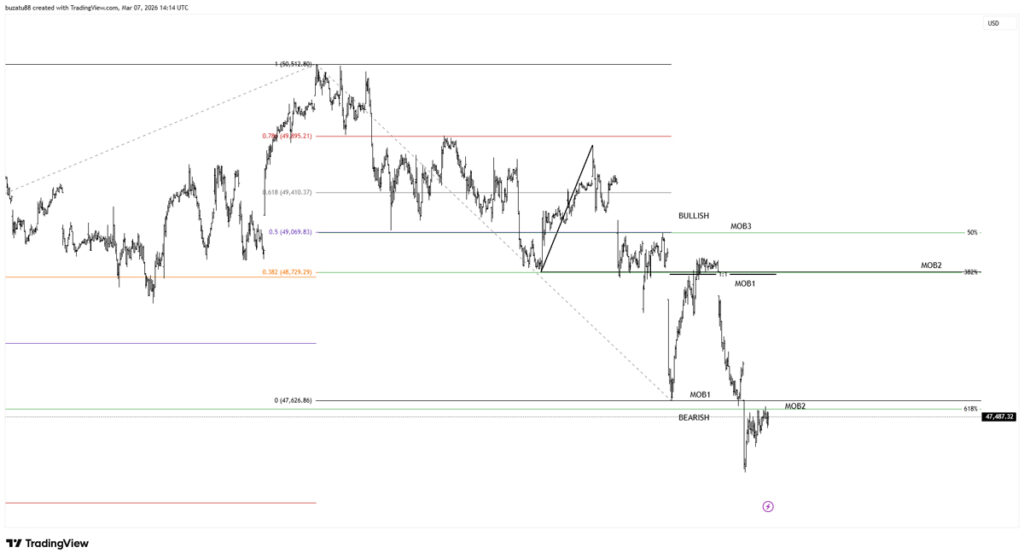
The trend is still down!
Final Thoughts
These are the core Dow Jones trading patterns I rely on every day.
There are other patterns I occasionally use, but these are the most reliable.
The real key to trading is combining multiple confirmations:
Fibonacci levels
Price structure
Pattern symmetry
Market context
The more factors that align together, the higher the probability of a successful trade.
And remember:
Patterns become more reliable on higher timeframes.