INTRO In this Dow Jones trading journal, I document a session filled with missed opportunities, bias, emotional decisions, and eventual recovery. This post is written for traders who are learning how market structure, patience, and discipline matter more than being right about direction.
MARKET CONTEXT
Date: Monday, 17th November 2025 Market: Dow Jones (YM) Session: US Open Market Condition: Volatile with failed breakouts and reversals
So, the 14th of November bar was on a Friday, and it closed in a doji /hammer style. Now, since Tuesday, the 14th of October, the market has rallied significantly, going into new ground until Wednesday, the 29th of October. Then it had a ‘’bad retracement’’ (a bad retracement is when the market overlaps and hardly goes anywhere), and it finished on a Gartley in 50%. With a beautiful bullish hammer bar. Providing a buy signal.
It succeeded in going up into new territory on a great four-bar rally. At which time it made a false break, falling 843 points and making a reversal pattern as well. But now what has happened is that from my research, a big down bar like that followed by a doji bar means the next day should be a bull up bar in more than 85% of the cases.
And this takes us to the current day. I see that the market hasn’t overbalanced the last correction. In fact, it has stopped 36 points above the 1:1. So, for starters, I am bullish on today’s action, but even though I have formed an opinion, I still have to wait and see what the market is telling me once it opens
BIAS & PRE-MARKET ANALYSIS
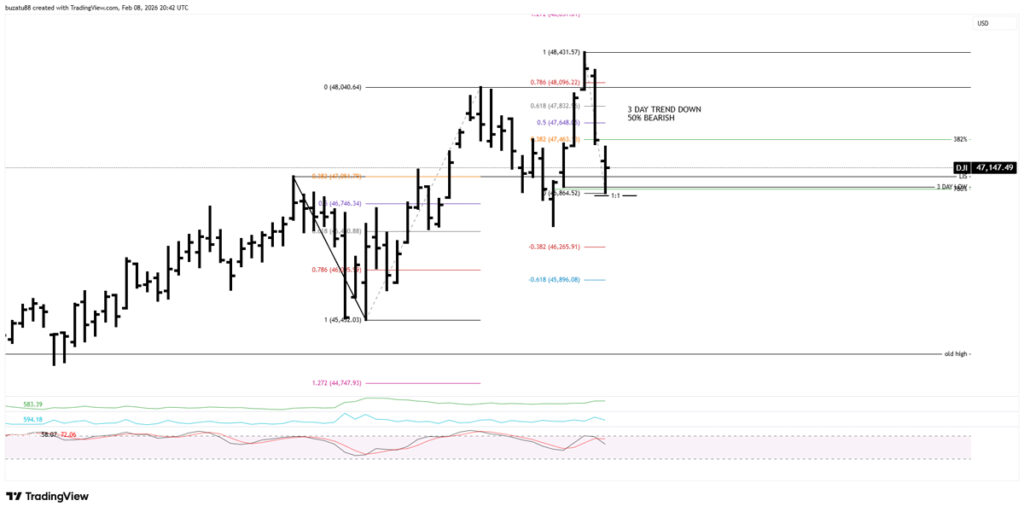
Looking at the hourly and 15-minute chart, I see that the market has finished exactly on an ABCD, coupled with a 50% retracement. This further strengthens my bullish hypothesis. But I still have to be mindful that the medium-term 3-day trend has been breached and it has closed below, and this signifies a change in trend, and also the market is still under the 50% retracement, which has weakness connotations as well
I am so bullish on this that I am beginning to think I may be very biased and look for any buy opportunity when there isn’t any. I have to wait and see what the market is doing. Looking at the 3 min chart right now, it must break the small double bottom low at 46,864 and break through the 1:1, which is at 46,834. And the above make-or-break levels are the top of Friday’s range, sitting at 47,380, and then the 382%, coupled with the gap from yesterday’s action
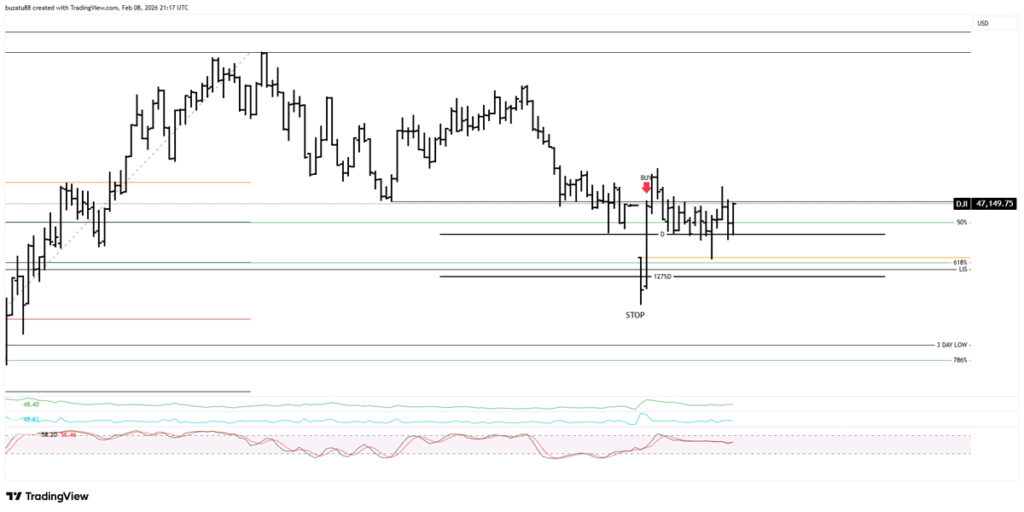
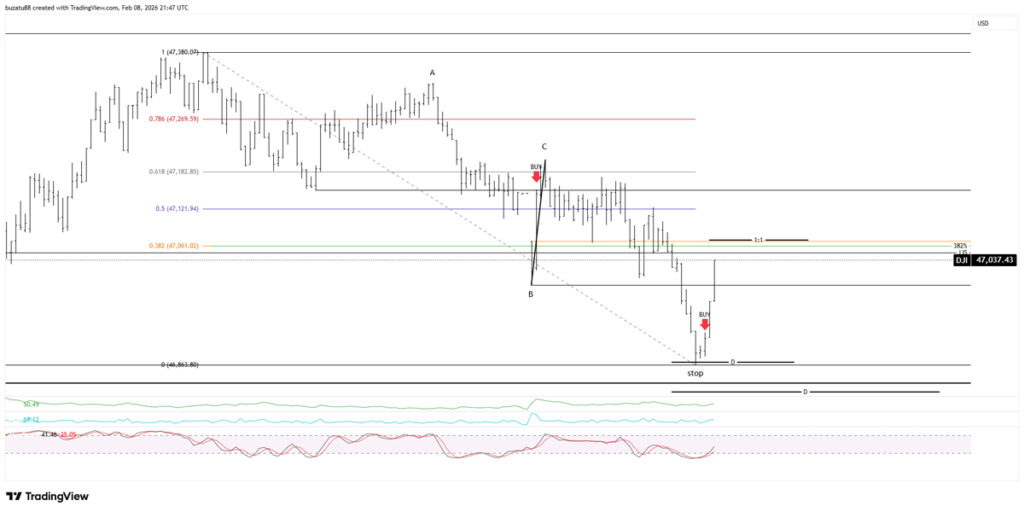
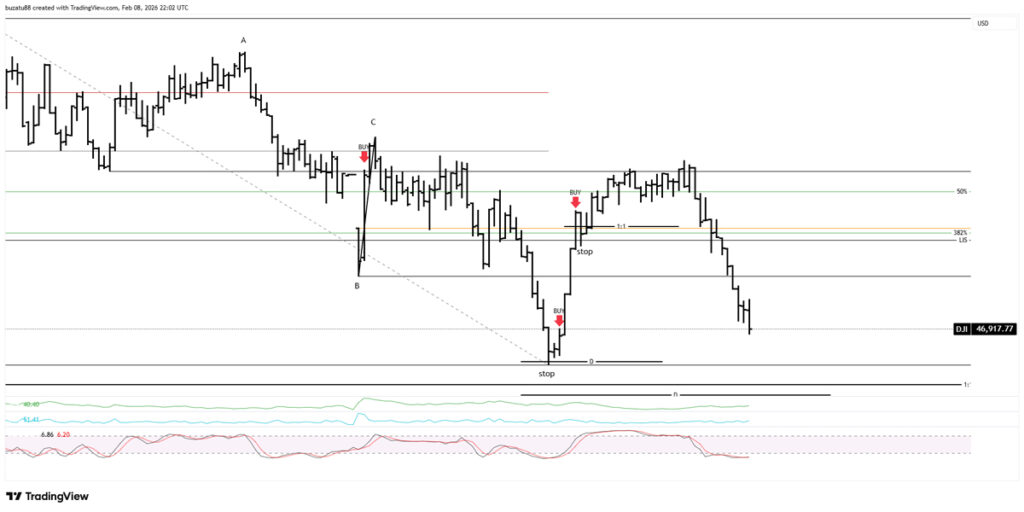
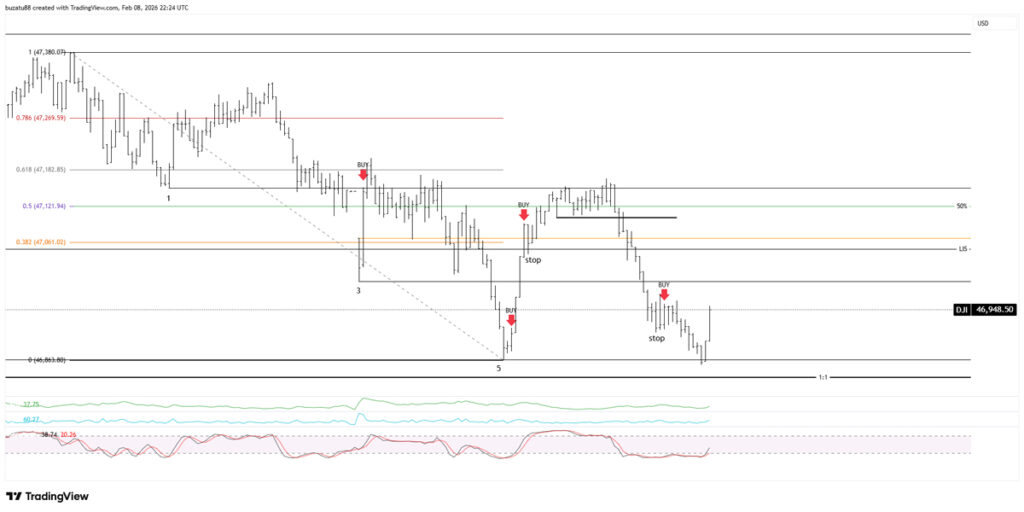
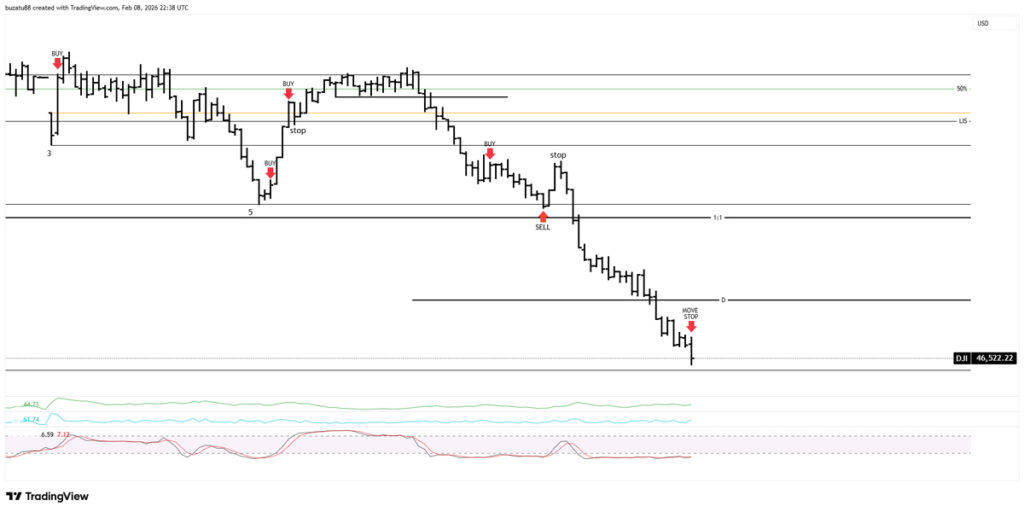
FIRST TRADE – BIAS TAKES OVER
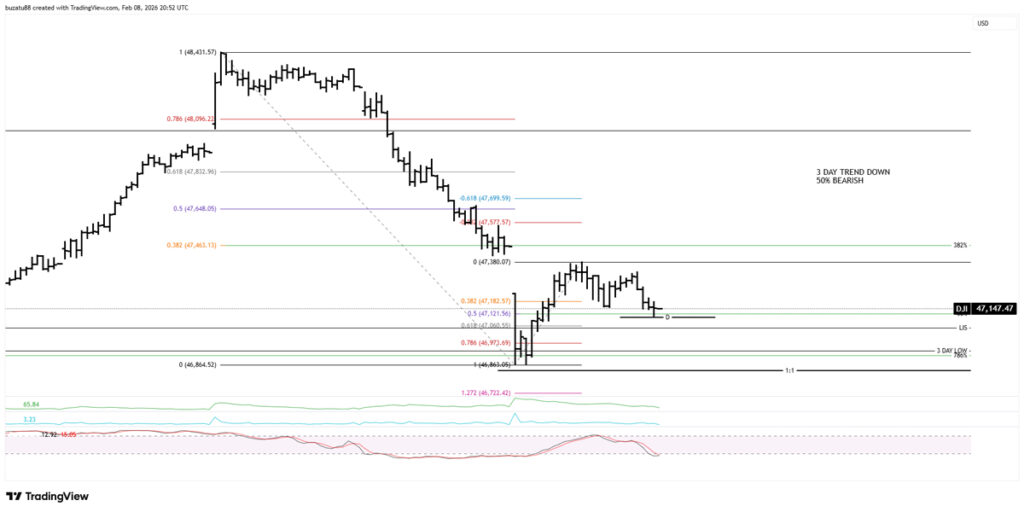
The bell has rung, and the market has opened lower than the ABCD. This suggests a continuation down, so let’s see. The second 3-minute bar has reversed and closed up in a strong manner right at resistance from a 618% Gartley, coupled with the LIS (Line in the Sand) from a few weeks ago. Even though it has surpassed the 1:1 ABCD, I will take a long here because it supports my bullish case, and if I look closely and extend the CD line by 1.272%, it will measure to 47,038, and the low is 46,995. I am taking a buy position here, 3 points above the high of the second bar of the day, with the stop below the low of the day
The market has triggered my order, and I am in the market and underwater for 45 minutes now. I am thinking I have made a mistake, and the trade won’t work, but I see it has retraced nicely from the opening price. All in all, I will let it play out, but too much time has passed, and it’s anyone’s game now. I was very sure it was going to go up, but now I am not so sure
The market has made an ABCD and rallied again, but I almost got stopped out. It does not look good so far
We went below the low of today, and I have been stopped out. I am out of the market and assessing my next move. It hurts, but not as much as I would have thought. I tested my hypothesis, and it didn’t play out. It’s funny how you can always find a reason why it didn’t after the fact!
Lesson:
For example, where I took my position long, the market was sitting right at resistance, having surpassed an important ABCD, and it finished the move right in a combined ratio of 618% from CD and 50% from AD. That is the geometry that has pushed the market lower, but I chose to ignore it, so I lost. Alright, now back in the saddle
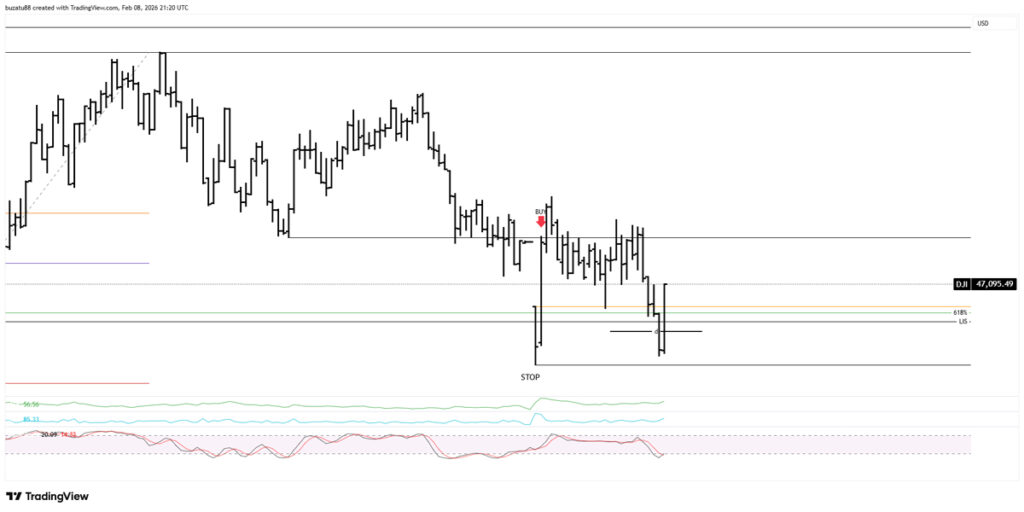
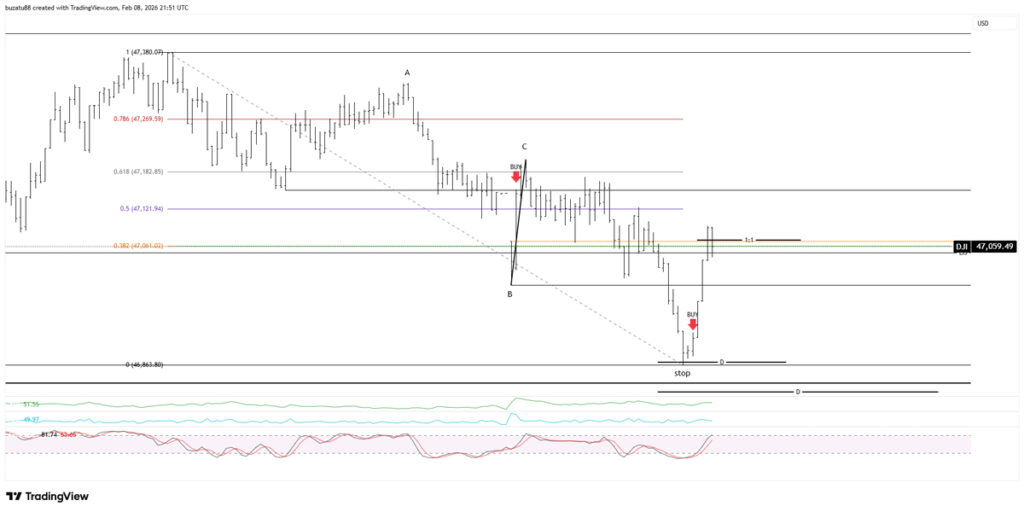
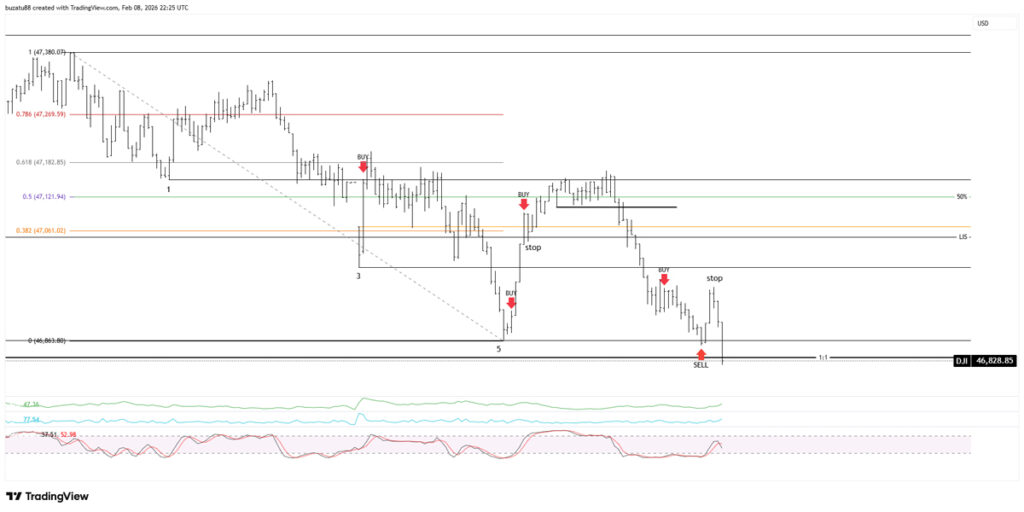
SECOND ATTEMPT – CONFUSION & OVERTRADING
The market has hit the bottom the 3rd time, and we have an ABCD right there, the stochastic is oversold, and it has made a reversal pattern with a butterfly pattern in 1.618% attached to it. It is better to sell double bottoms than buy them. The reason is, when traders see weekness they tend to hammer it. That is why markets fall faster than they rise. I will take a long here, and if it goes below the low, I will sell short
So far, the market has agreed with me, but now we have to negotiate a strong resistance zone where the 382%,1:1, LIS, and the open are aligned together. This is strong resistance, and if we go through, we will go much higher, so let’s see
It has blasted through the levels and reversed. It’s to be expected because there is strong resistance there. And yes, it could return the other way, but I will keep the trade, and if it goes above, I will add to it. I forgot to mention I have moved the stop to breakeven after the second bar up
I have added to my trade, and the market has moved above the 50% and is close to the resistance from yesterday
The market is moving sideways, it’s not the action I want, so I’m moving the stop loss to breakeven on the add-on trade
I have been stopped out of both my trades. It hurts! I couldn’t exit at a profit for the first trade. I kept hoping!
📌 Mistake:
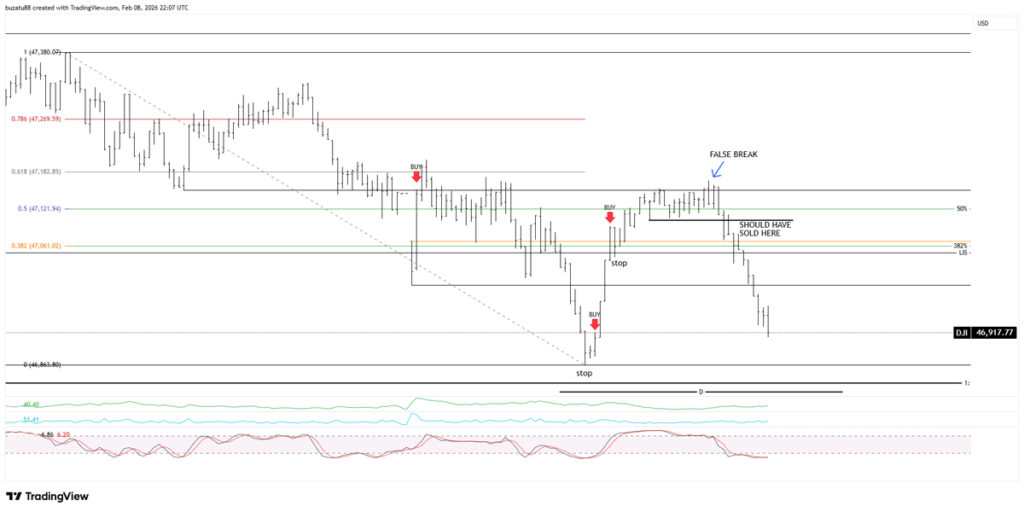
What I should have done was to move both stps bellow the trading range that has formed, and after the false break, I should have reversed short because all the signs are there. Hope is a hard thing to negotiate when you are in a trade
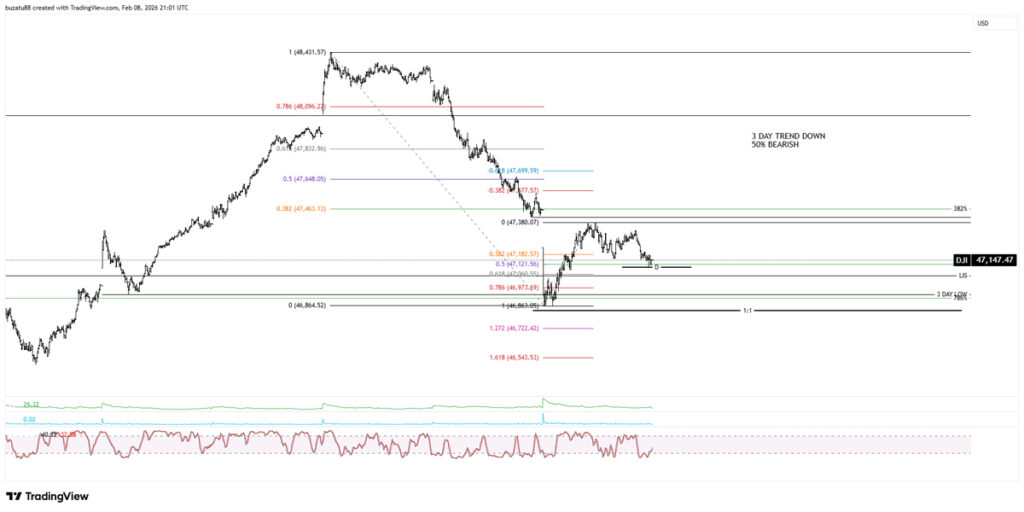
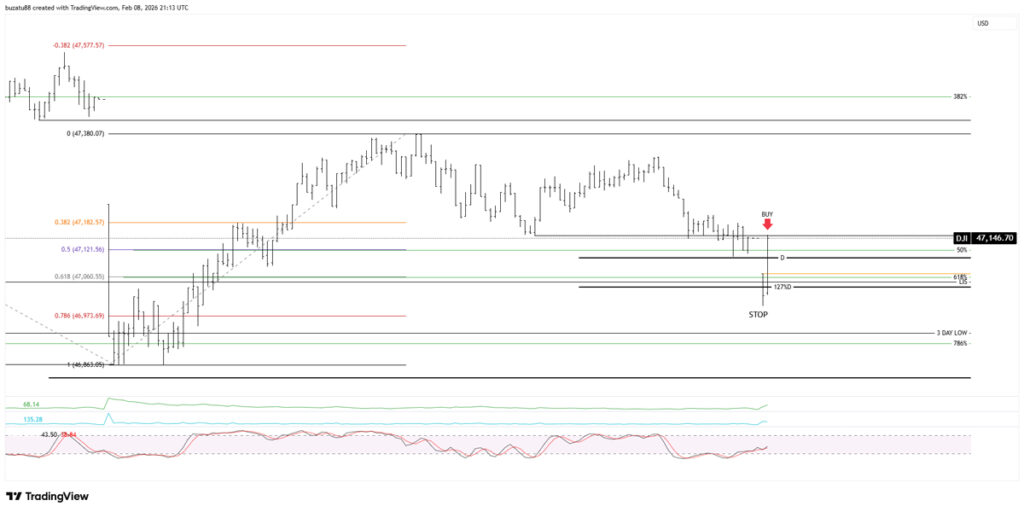
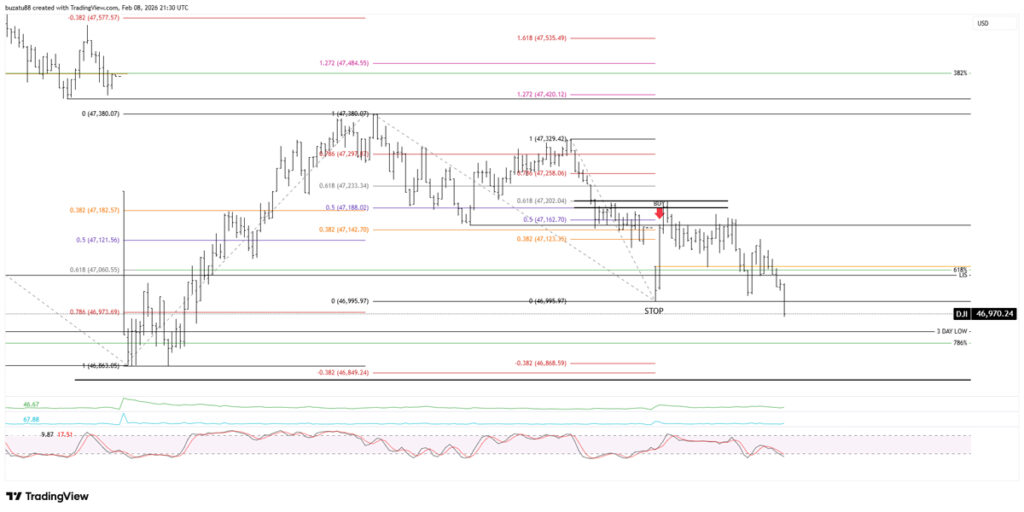
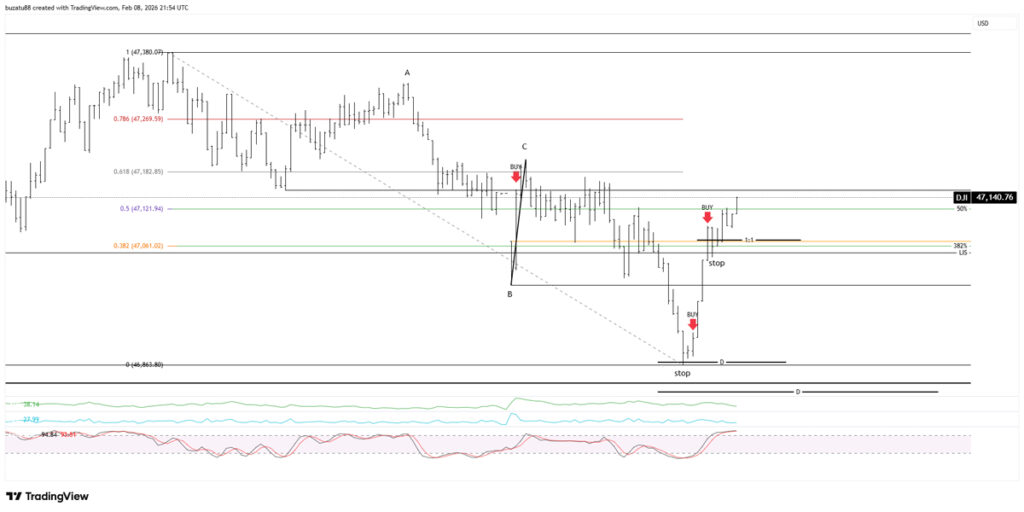
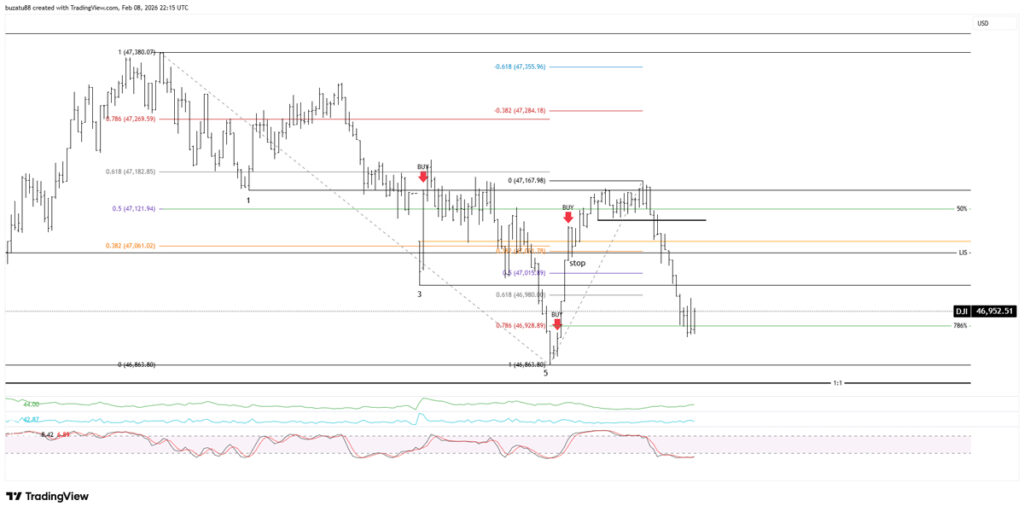
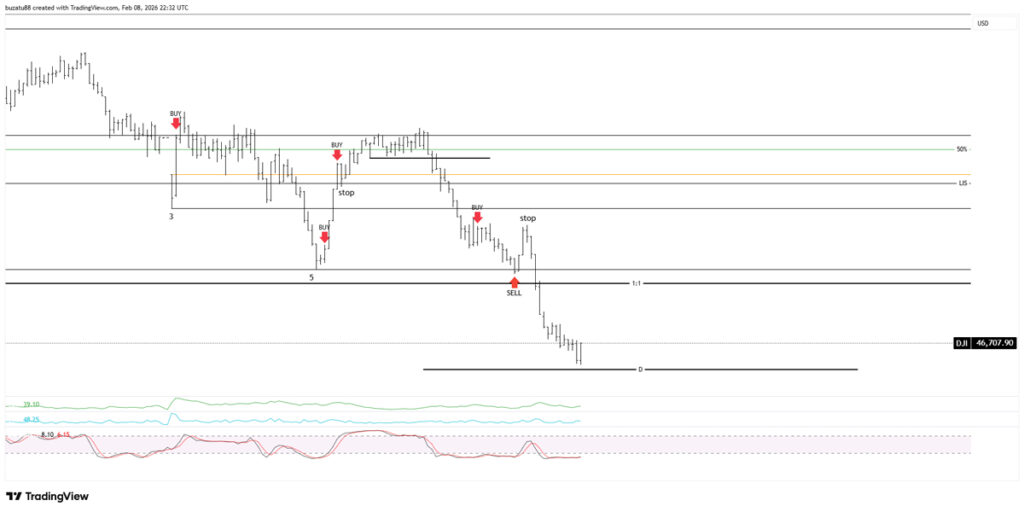
We have a 1-3-5 pattern with a double bottom pullback in 786% and a reversal bar signal, albeit not a very good one. I will take a long here 3 points above the 18:12 bar with a stop 3 points below the low. And if it fails, I will go short if it reaches the triple bottom, as usually the 4th time brings on a good trade, I will wait and see
I have been stopped out in no time. I am out of the market and waiting on the sidelines. Today hasn’t gone very well for me so far
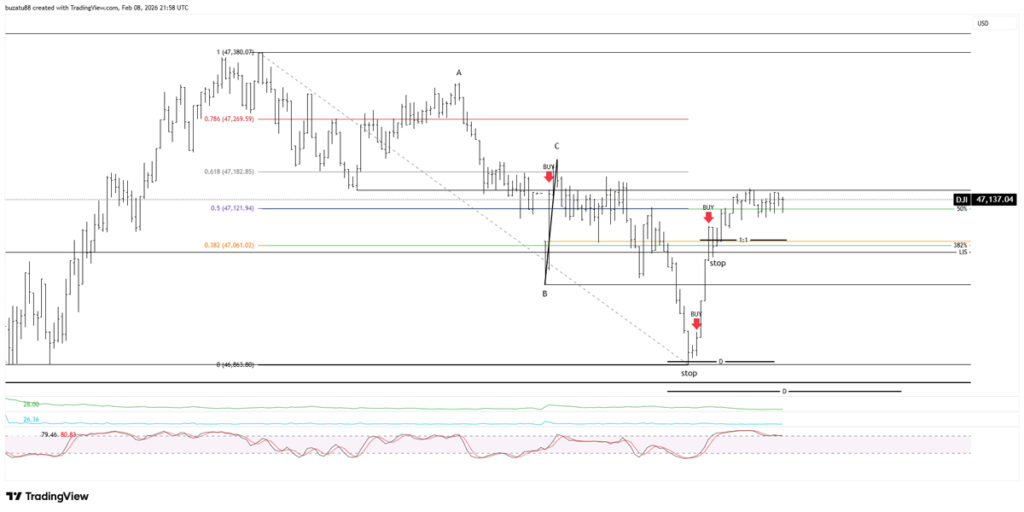
We have made a new low at 48,855. The 4th try has held, and we may see the market going up. I would have sold, but it did not go 3 points below the low bar. The market came down and, after a short retracement, proceeded to move down in a ‘’bad continuation’’ fashion. That is always a sign of reversal in my book, but I see I have been making all the wrong decisions so far.
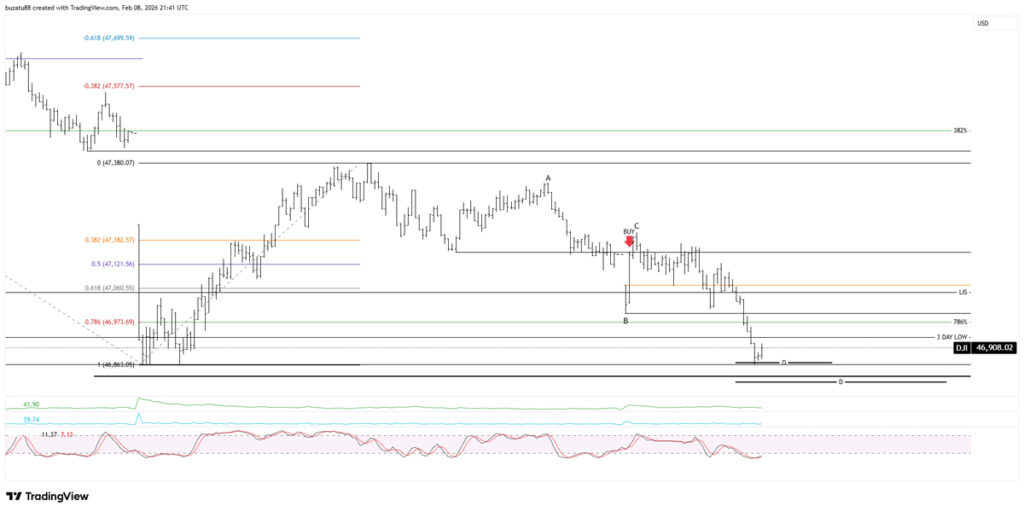
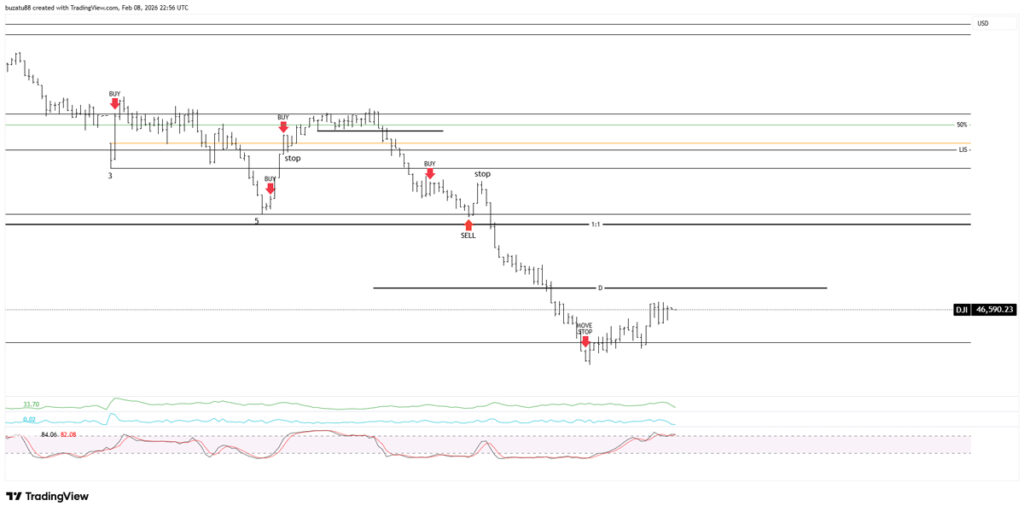
FINAL TRADE – PROCESS RETURNS
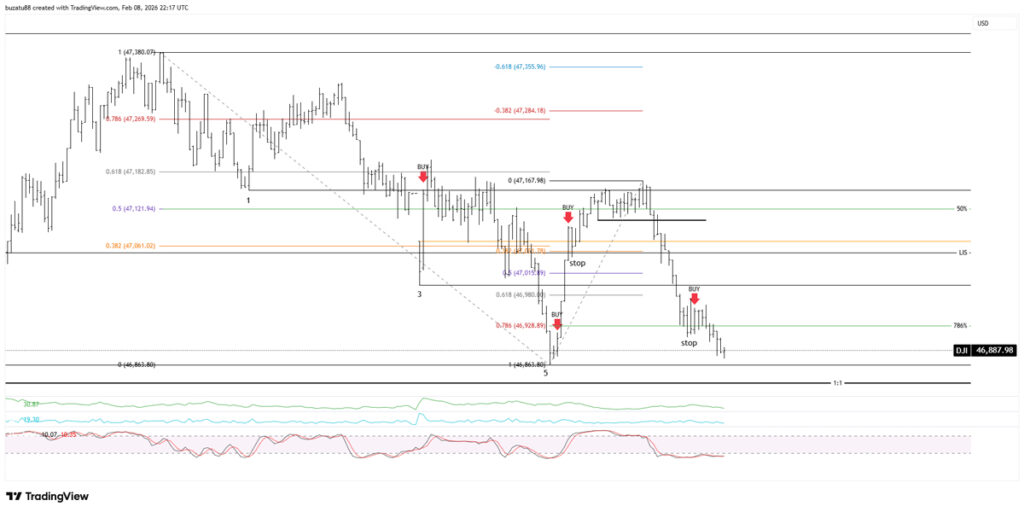
Market reversed, and I have sold it at the 4th low
I have moved the stop up to breakeven after the second bar down after the entry. And we have overbalanced the previous correction to a major degree, so let’s see what will happen. The market has gone down close to the big ABCD from the day’s action and is showing signs of bad continuation
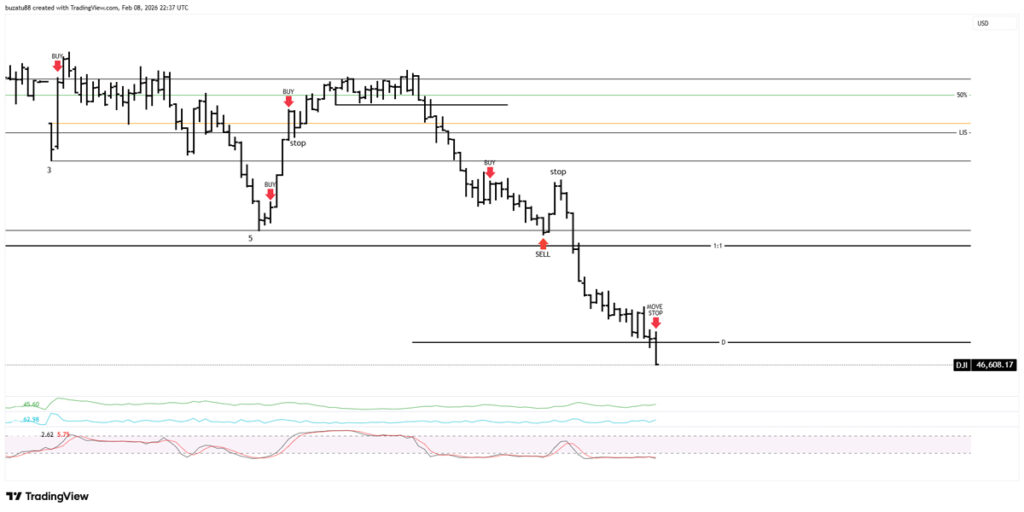
The market has moved through the ABCD and overbalanced. This is usually a good sign that the trend will continue. I have my eyes on the 46,495 low as a possible target. That being said, it is 19:36 now, so I want to protect some profit, so I will move my stop down 3 points above the 19:36 bar
I have moved my stop loss again
We have gone below the 46,495 major low. I have moved my stop down two more times, and I was finally taken out of the market. I have lost two trades, which total – 217 points, and won one trade, which has made me +374 points for a total of + 157 points. This would have been a good day in the end.
But I risk 3% of my account per trade. That 3% is divided by the number of points I risk, and it gives me my stake (how much I put per point). And after all that, the amount I made is a measly £78 from a £5000 account. If the account were bigger, it would have been a pretty good day. This goes to show that the amount of points you win doesn’t always translate to what you would think. And the market has moved sideways to up from that false break into the close
📌 Key Lesson: Points do not equal money. Account size and risk management matter more than being right.